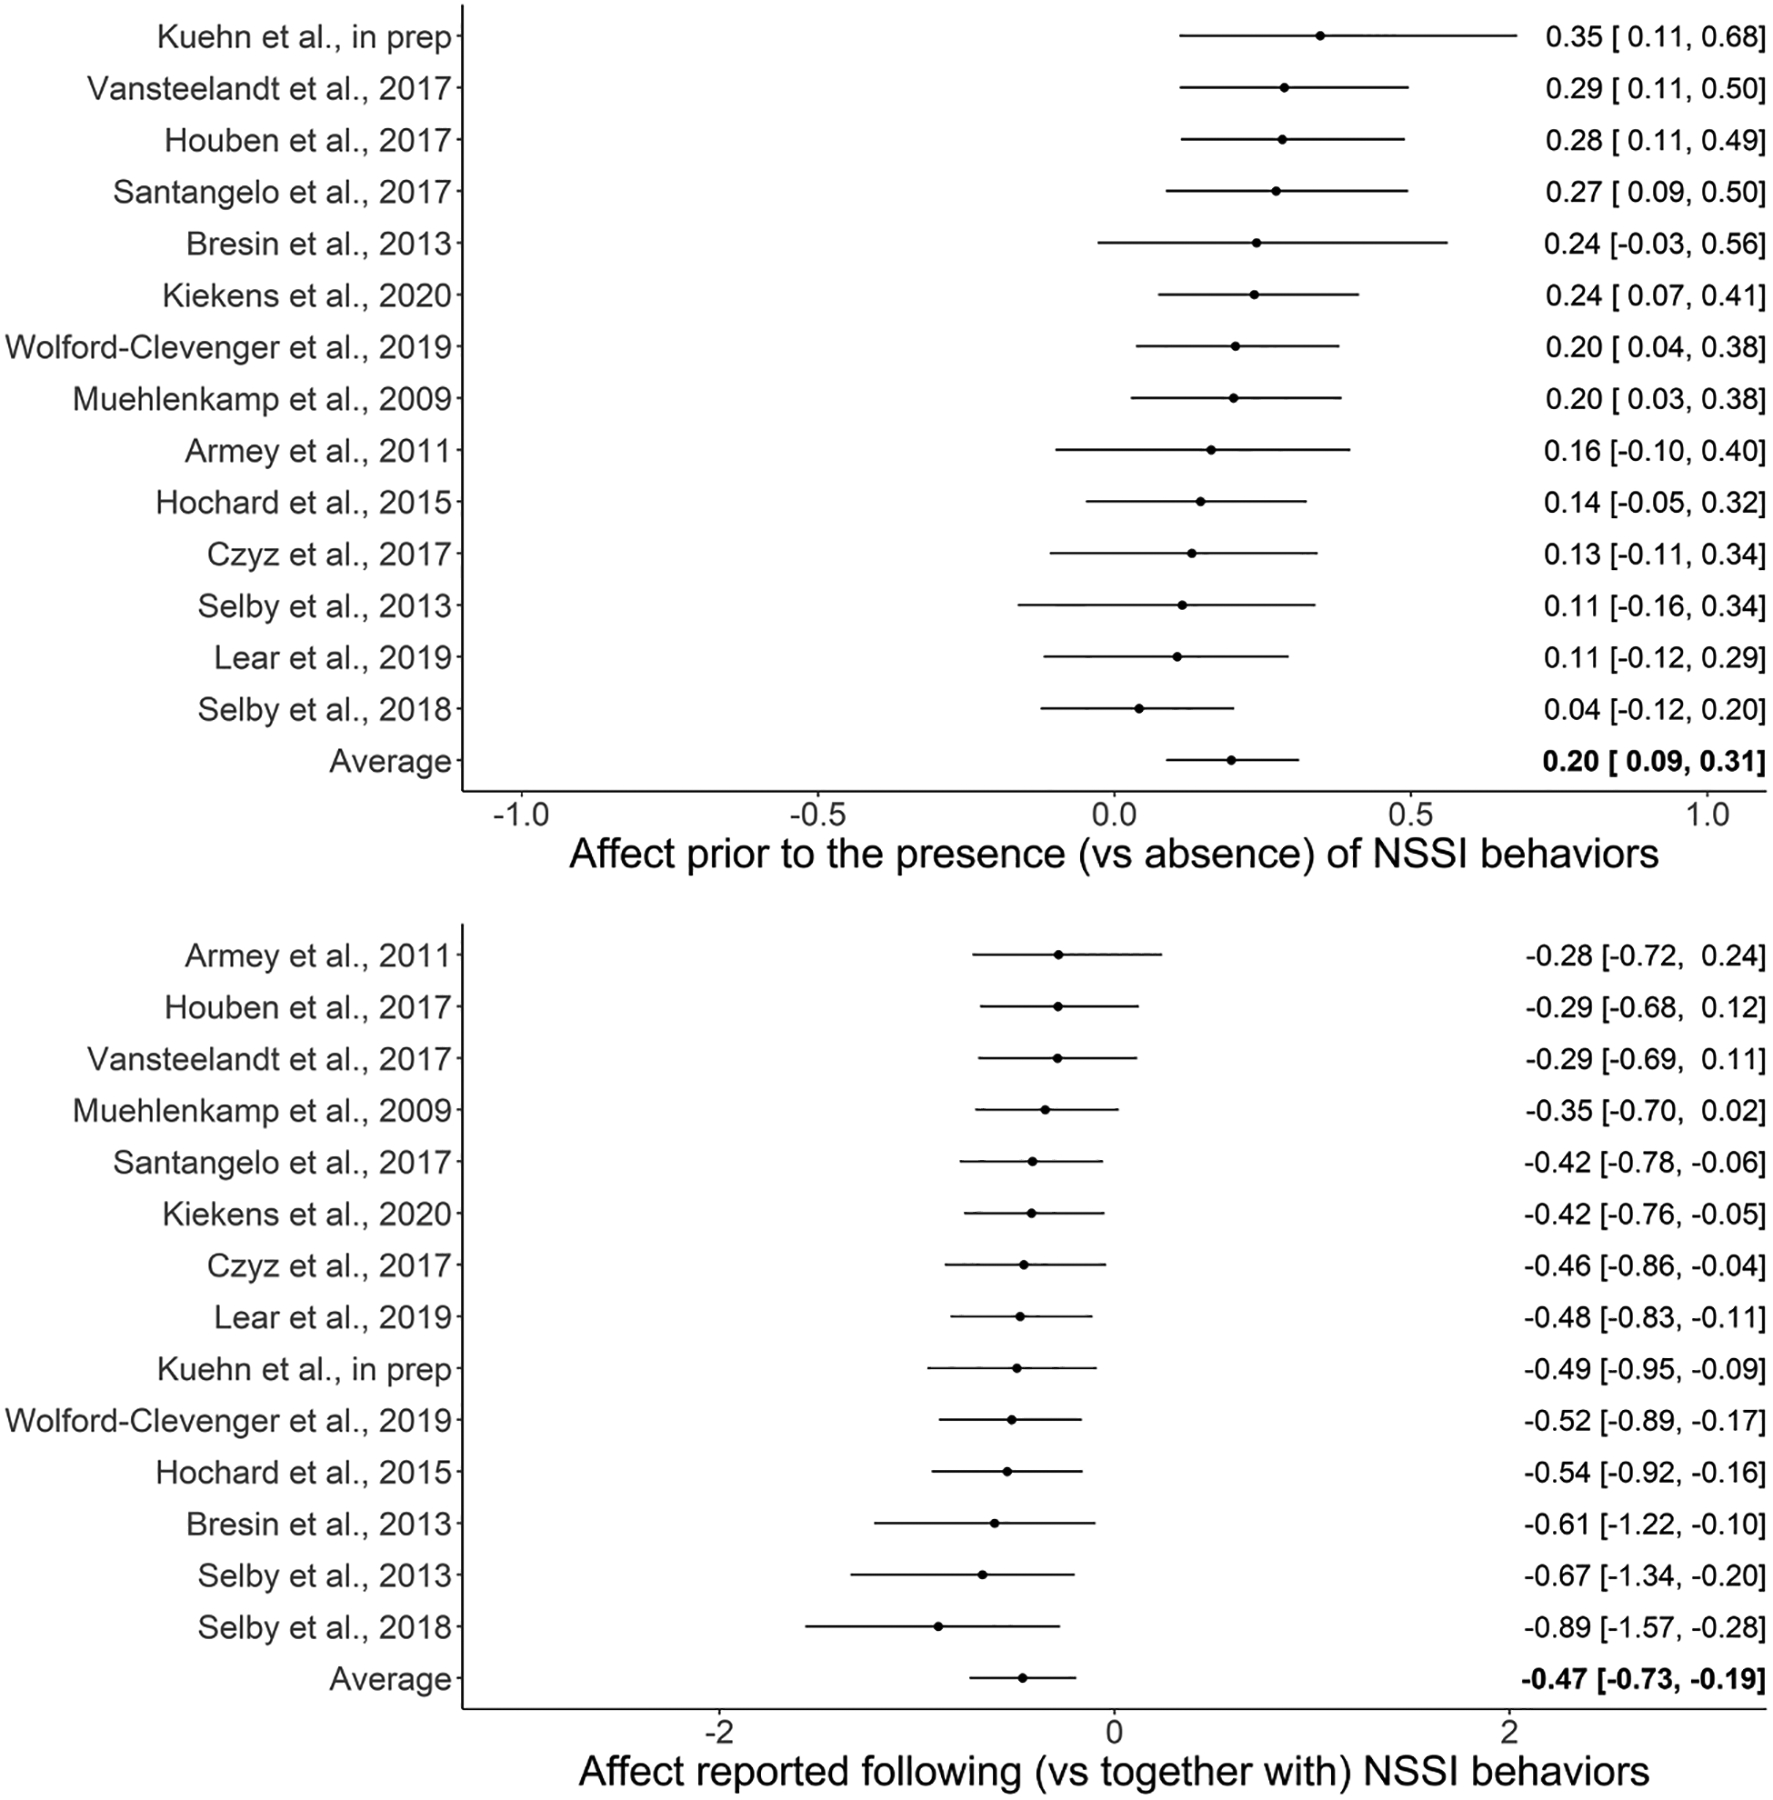
Figure 2.

Forest plots of NSSI Behaviors in both Antecedent and Consequence Models. Effect sizes from antecedent (top) and consequence (bottom) models of the negative affect, NSSI behavior association (n = 897 participants nested in 14 studies). Data presented as random effects estimates from a three-level model +/− 95% credible interval.
*Notes: Average effect size (fixed effect from three level model and 95% credible interval) is in bold at the bottom of the respective plots.
