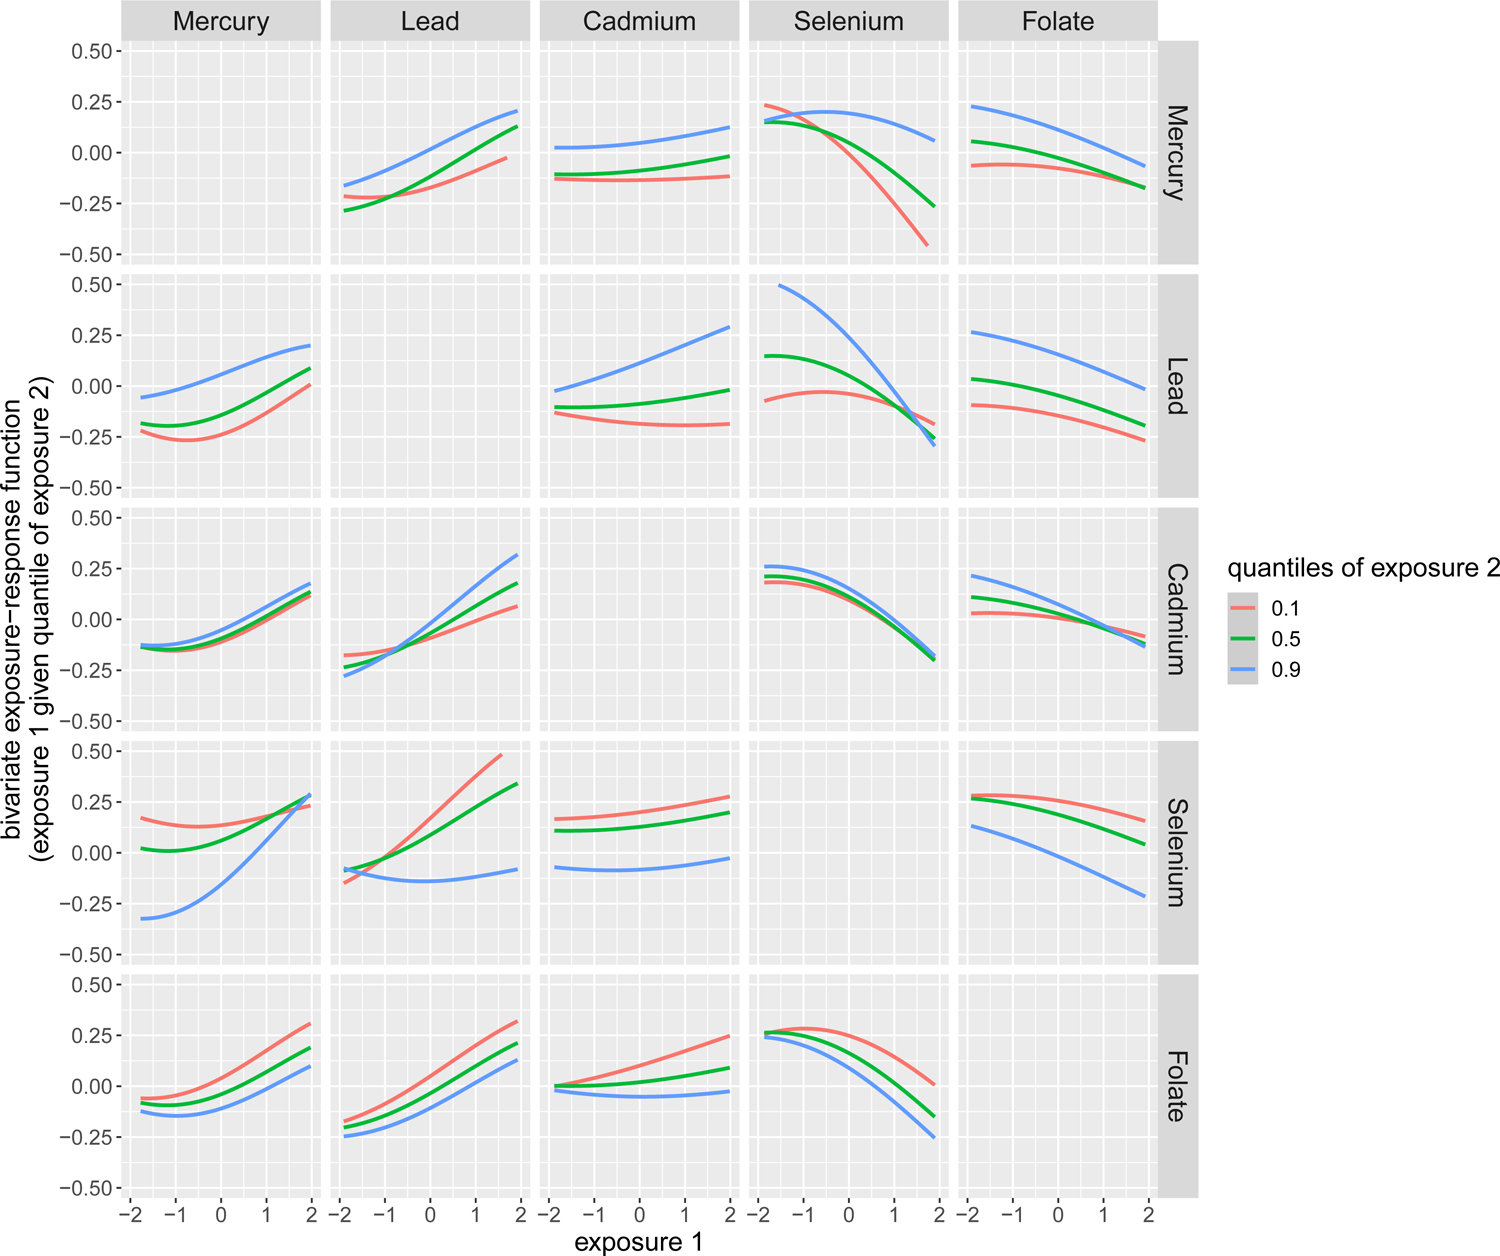
Fig. 3. Bivariate dose-response function of toxic metal (Hg, Pb, Cd) and micronutrient (Se, folate) exposures on child overweight or obesity (OWO) among children born to mothers with OWO.

The bivariate dose-response function was obtained by plotting the dose-response function of a single predictor (exposure 1) when the second predictor (exposure 2) was fixed at various quantiles as labeled, while the remaining predictors were fixed to their median values. Maternal age, BMI, race/ethnicity, marital status, education level, parity, breastfeeding type, smoking status, fish intake, child’s sex, low birthweight, and preterm status were included as the covariates. The x-axis was limited to a range from −2 to 2, which reflects the z-score. Refer to the Supplement for the full range plot (Fig. S11).
