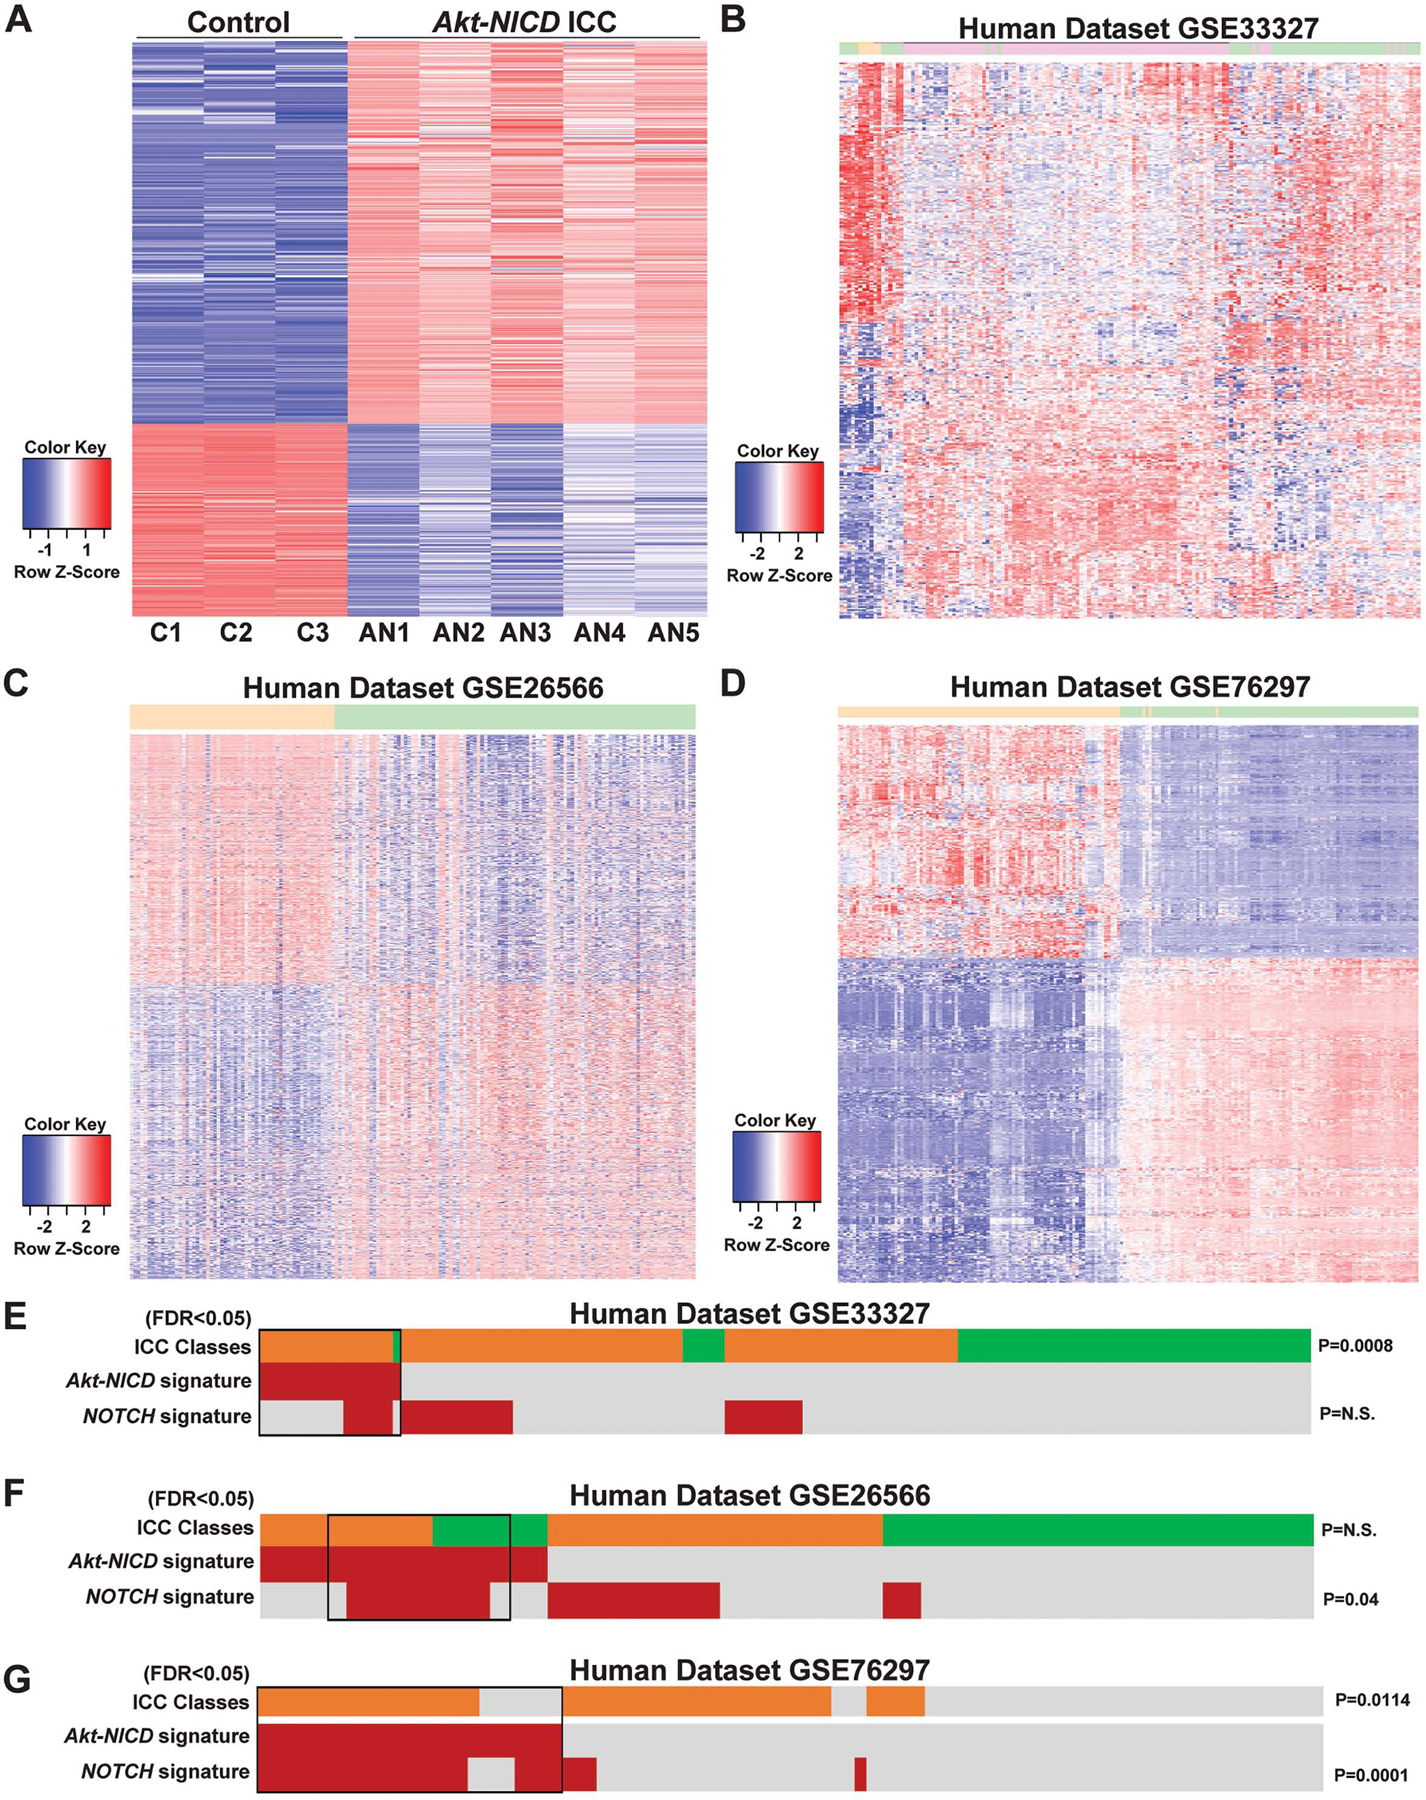
Figure 2: RNA-seq analysis of murine Akt-NICD ICC model and comparison with human ICC cases.

(A) Heatmap for the differentially expressed genes comparing wild-type (WT) liver and Akt-NICD ICC. (B) Heatmap of gene signatures in human GSE33327 study that are selected by mouse model (WT VS Akt-NICD). Orange: normal; Green: inflammation-class; Pink: proliferation-class. (C) Heatmap of gene signatures in human GSE26566 study that are selected by mouse model (WT VS Akt-NICD). Orange: surrounding liver; Green: ICC. (D) Heatmap of gene signatures in human GSE76297 study that are selected by mouse model (WT VS Akt-NICD). Orange: non-tumor; Green: ICC. Nearest Template Prediction (NTP) analysis of three human whole-tumor gene expression datasets GSE33327 (E), GSE26566 (F) and GSE76297 (G) using the Akt-NICD signature generated in this study. Inflammation class is indicated in green; Proliferation class is indicated in orange. In the heatmap, each column represents a patient, and each row represents a different signature; positive prediction of signatures as calculated by NTP is indicated in red and absence in gray. p values that show significant correlation are indicated to the right of the NTP analysis.
