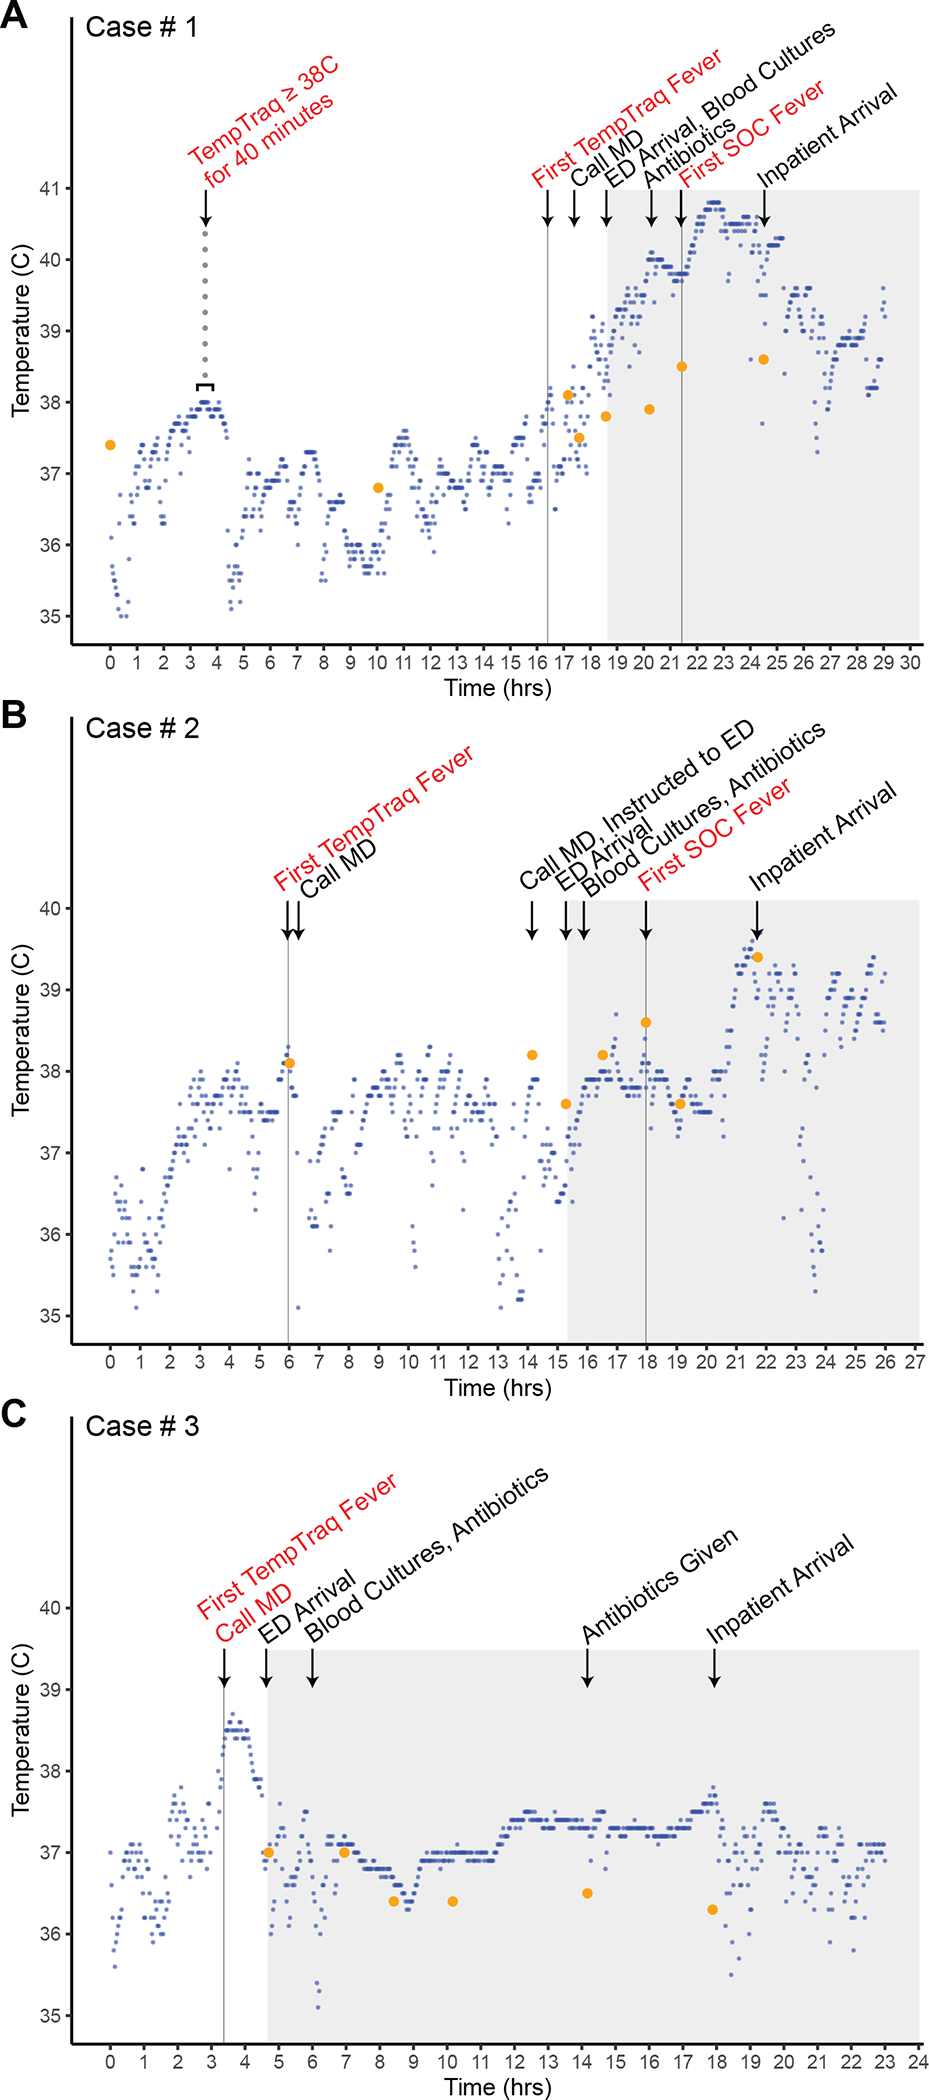
FIGURE 1. HFTM monitoring data for the three cases described in the main text.

HFTM data points are plotted in blue, with temperature data points measured by family caregivers or nursing staff using a standard thermometer plotted in orange, for each of the cases described in the main text. The gray shaded area corresponds to time points when the patient was at the healthcare facility. MD = physician; ED = emergency department. SOC = standard of care, which refers to temperature measured using a standard thermometer by clinical staff.
