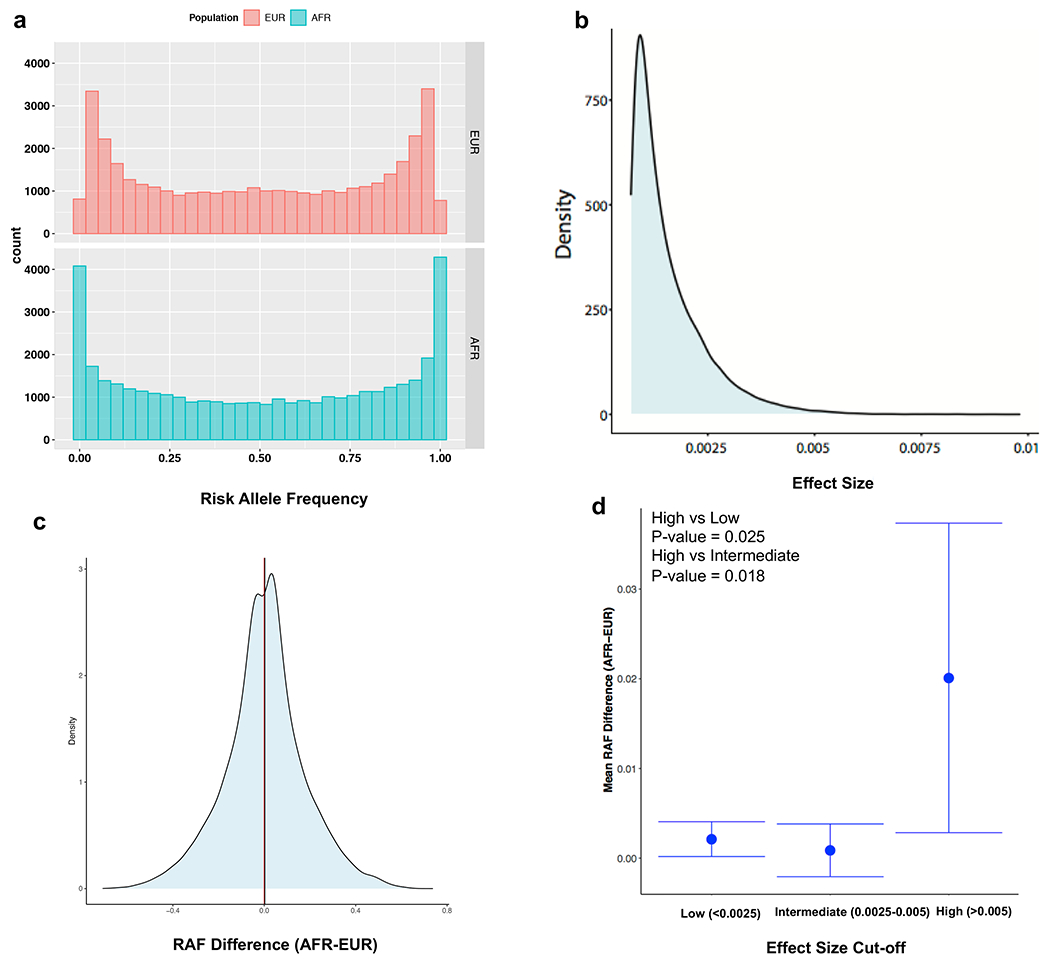
Extended Data Fig. 1. Distribution of risk allele frequencies (RAF) and their effect sizes for the variants included in the GPS.

(a) comparison of RAF distributions for the risk variants included in the CKD GPS demonstrates higher frequency of rare (RAF<0.01) and common (RAF>0.99) risk alleles in African compared to European genomes (based on 1000G reference populations); this may be explained by the exclusion of variants with MAF<0.01 in European discovery GWAS; (b) highly skewed effect size (weight) distribution for the variants included in the GPS for CKD; (c) Distribution of RAF difference (AFR-EUR) demonstrating higher average frequency of risk alleles in African genomes (mean RAF difference = 0.002) and a slight rightward shift of the RAF difference distribution from the expected mean of 0; (d) Mean RAF difference (AFR-EUR) as a function of effect size binned into three categories (high, intermediate, and low) based on the observed distribution of effects sizes in panel b, demonstrating that the risk alleles with larger effect size have higher average frequency in African compared to European genomes. EUR: European (N=503) and AFR: African (N=661). The bars represent 95% confidence intervals around the mean RAF difference estimate for each bin; two-sided P-values were calculated using t-test.
