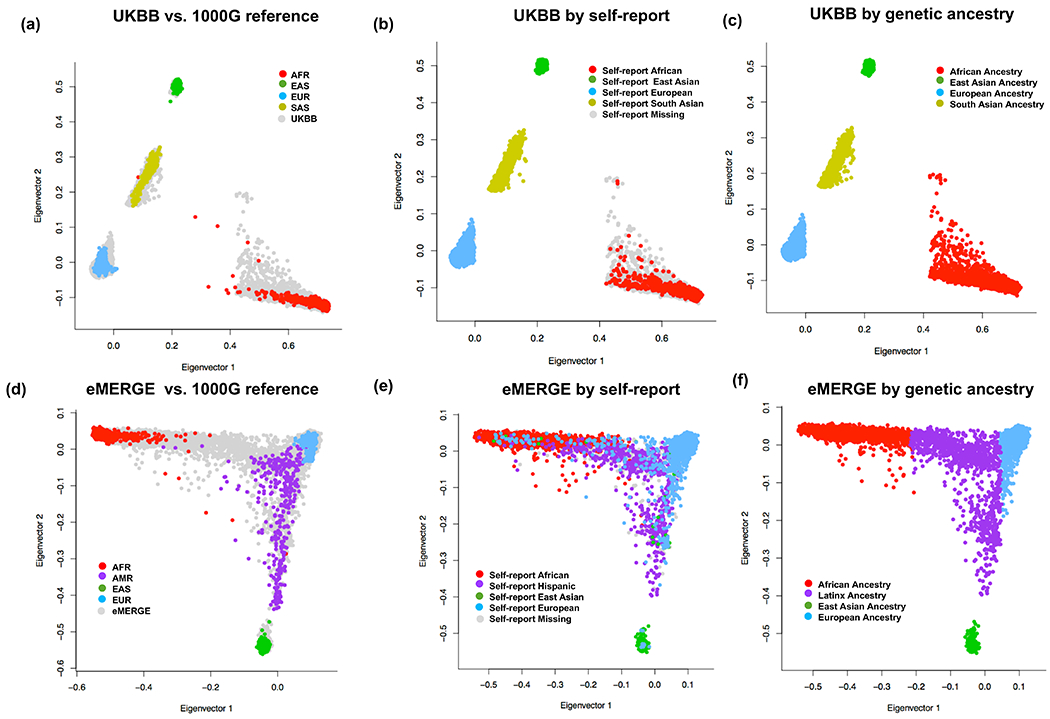
Extended Data Fig. 5. PCA projections of the study participants from the UKBB (top) and eMERGE-III (bottom) against the 1000G reference populations.

(a) UKBB (N=77,584) and (b) eMERGE-III (N=22,453) participants plotted against the reference 1000G populations (N=2,504); (b, e) plotted by self-reported race/ethnicity; and (c, f) plotted by final ancestry group assignment. X-axis: PC1; Y-axis: PC2; AFR: African; AMR: Native American; EAS: East Asian; EUR: European; and SAS: South Asian.
