
FIGURE 1.
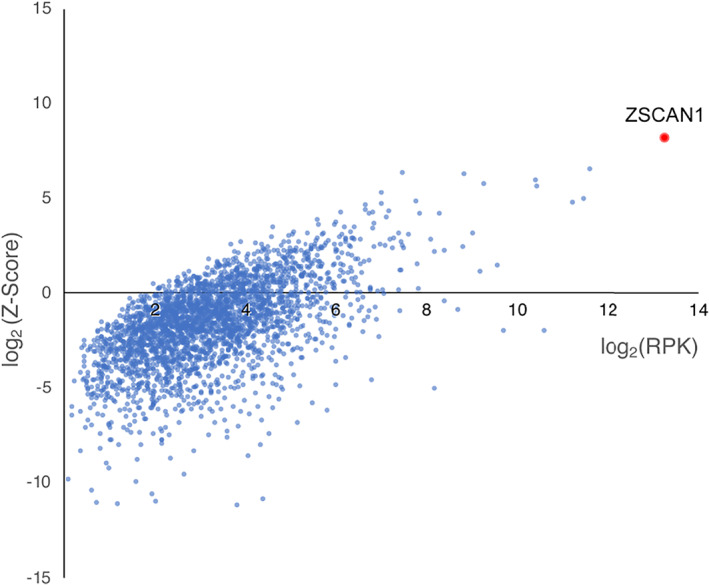
PhIP‐Seq screen implicates ZSCAN1 as a candidate autoantigen in ROHHAD. CSF from 3 ROHHAD patients (ROHHAD‐1 to ‐3) and plasma from a large set of “healthy controls” (n = 100) were tested by PhIP‐Seq. Individual data were averaged according to cohort. All proteins with a ROHHAD mean RP100K >0 are plotted against ROHHAD Z‐score enrichments compared to healthy controls. Non‐ZSCAN1 proteins are denoted with blue dots; ZSCAN1 is denoted with a red dot.