
FIGURE 3.
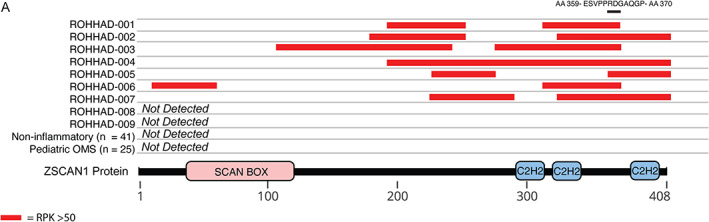
Peptide‐level ZSCAN1 enrichments by ROHHAD patients, informed by PhIP‐Seq. Cartoon graphic of the 408 amino acid ZSCAN1 protein with annotated SCAN and C2H2 domains is depicted below. Horizontal tracks above ZSCAN1 represent peptide enrichment data from individual ROHHAD patients or aggregated data from control cohorts. All peptides belonging to ZSCAN1 with enrichment RP100K >50 were plotted as red bars, merging together peptides with overlapping regions within individual tracks to reflect span of antigenic area. The black bar above all tracks represents an 11 AA region of overlap in 100% (7/7) patients within the C‐terminal domain. The amino acid sequence for the region of overlap is depicted above the black bar.