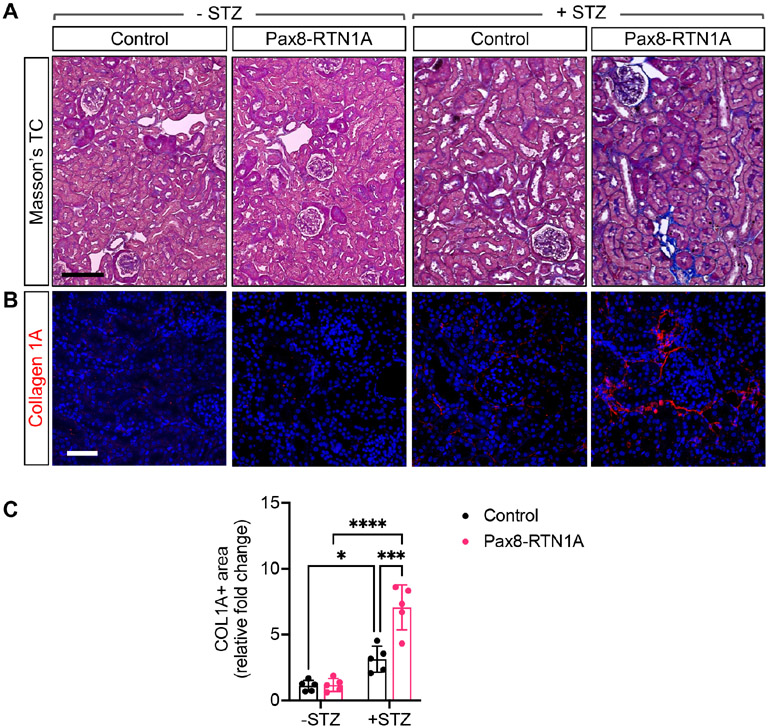
Figure 2: TEC-specific RTN1A overexpression accelerated renal fibrosis in STZ-induced diabetic mice.
(A) Masson's trichrome-stained kidney sections of control and Pax8-RTN1A mice. Scale bar, 25μm. (B) Representative image of collagen 1A immunostained kidney sections. DNA is counterstained in blue. Scale bar, 30μm. (C) Quantification of average fold change in collagen 1A+ area is shown per mouse (n=5 mice per group, 10-12 fields evaluated per mouse). *p<0.05, ***p<0.001, and ****p<0.0001 between indicated groups by two-way ANOVA with Tukey's post hoc analysis.

