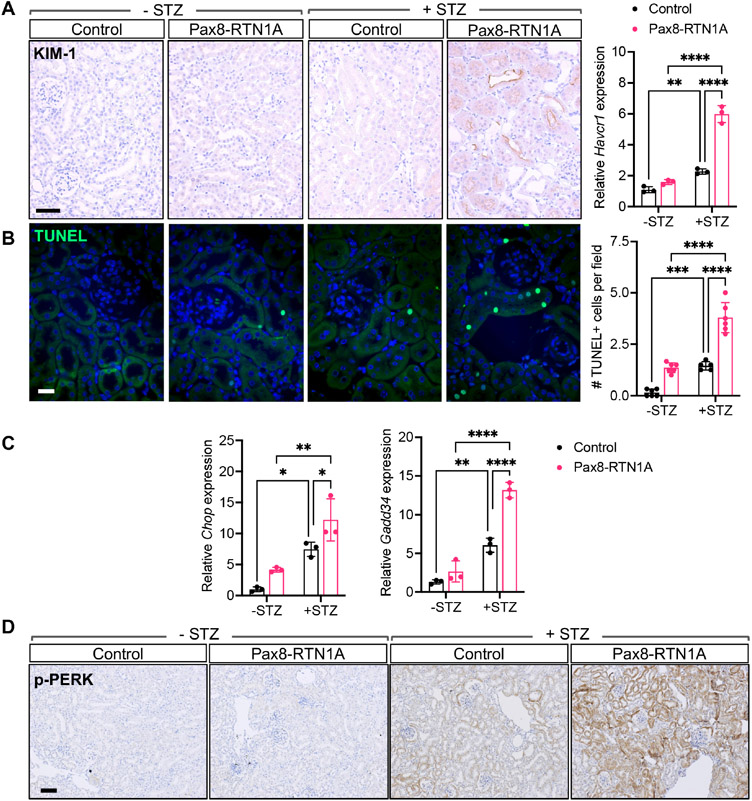
Figure 3: TEC-specific RTN1A overexpression accelerated tubular injury and death in STZ-induced diabetic mice.
(A) Representative image of KIM-1 immunostaining shows significant KIM-1 staining only in the diabetic Pax8-RTN1A mouse kidneys. Scale bar, 30μm. Real-time PCR analysis of Havcr1 in kidney cortices of control and Pax8-RTN1A mice is shown on the right (n=3 mice per group). (B) TUNEL-stained kidney sections. DNA is counterstained in blue. Scale bar, 10μm. Quantification of average TUNEL+ cells per field per mouse is shown on the right (n=5 mice per group, 10-12 fields evaluated per mouse). (C) Real-time PCR analysis of ER stress markers Chop and Gadd34 in kidney cortices of mice (n=3 mice per group). (D) Representative images of phosphorylated PERK (p-PERK) in kidney sections of control and Pax8-RTN1A mice. Scale bar, 20μm. *p<0.05, **p<0.01, ***p<0.001, and ****p<0.0001 between indicated groups by two-way ANOVA with Tukey’s post hoc analysis.

