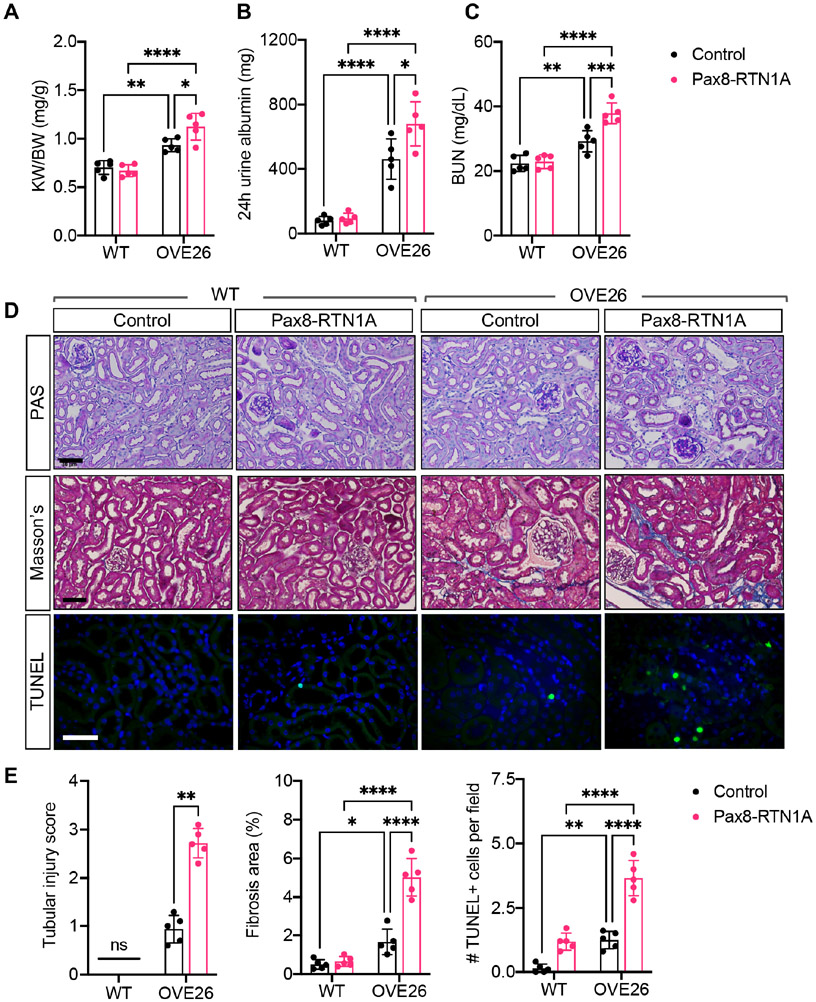
Figure 4: TEC-specific RTN1A overexpression accelerated renal function decline and renal fibrosis in OVE26 diabetic mice. Nondiabetic (WT) and diabetic OVE26 mice were evaluated at 24 weeks of age.
(A) Kidney-to-body weight (K/BW) ratio. (B) Total 24-hour urinary albumin excretion. (C) Blood urea nitrogen (BUN) levels. (D) Representative images of periodic acid-Schiff (PAS)-, Masson's trichrome-, and TUNEL-stained kidneys. Scale bars: 30μm. (E) Quantification of average tubular injury score, trichrome-stained fibrosis area (%), and TUNEL+ cells per field is shown per mouse (n=5 mice per group). *p<0.05, **p<0.01, ***p<0.001, and ****p<0.0001 between indicated groups by two-way ANOVA with Tukey's post hoc analysis or nonparametric Mann-Whitney test (for tubular injury scores).

