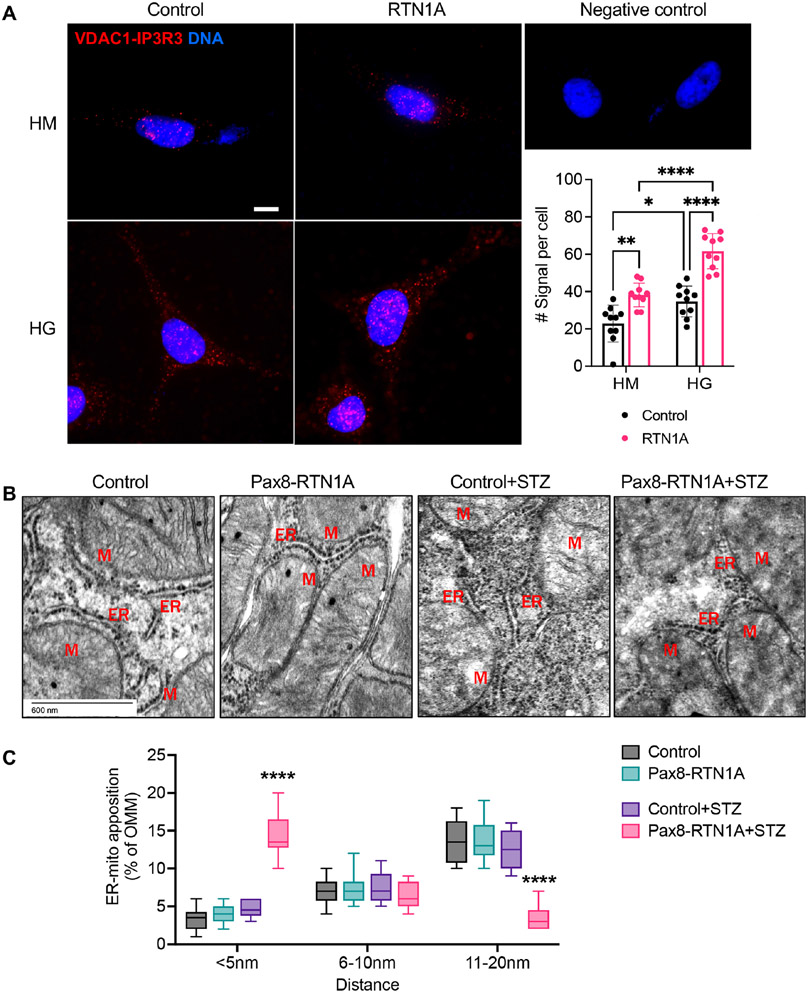
Figure 5: RTN1A overexpression increased the EMC contact sites cultured cells and reduced the distance of EMCs in tubular cells in vivo.
(A) Representative images of in situ proximity ligation assay targeting IP3R3-VDAC1 interaction in control or RTN1A overexpressing HK2 cells that were cultured high mannitol (HM, 25mM+5mM glucose) or high glucose (HG, 30mM) media for 24 hours. PLA red fluorescent dots indicate the location and extent of IP3R3-VDAC1 interaction. Nuclei were stained with DAPI. Each picture is representative of a typical cell staining observed in 10 fields chosen at random. Scale bar, 10μm. Quantification of the PLA signal per cell is shown on the right (average number of dots per cell, n=10 fields per condition). *p<0.05, **p<0.01, and ****p<0.0001 between indicated groups by two-way ANOVA with Tukey’s post hoc analysis. (B) Representative transmission EM images of areas of mitochondria-ER appositions in control and diabetic mice. Examples of distances are indicated. Scale bar, 20μm. (C) Quantification of the relative amount of OMM in contact with ER for each distance category (less than 5, between 6-10, and between 11-20nm). n=10-50 mitochondria in 10 fields per group. ****p<0.0001 compared to all groups by two-way ANOVA with Tukey’s post hoc analysis.

