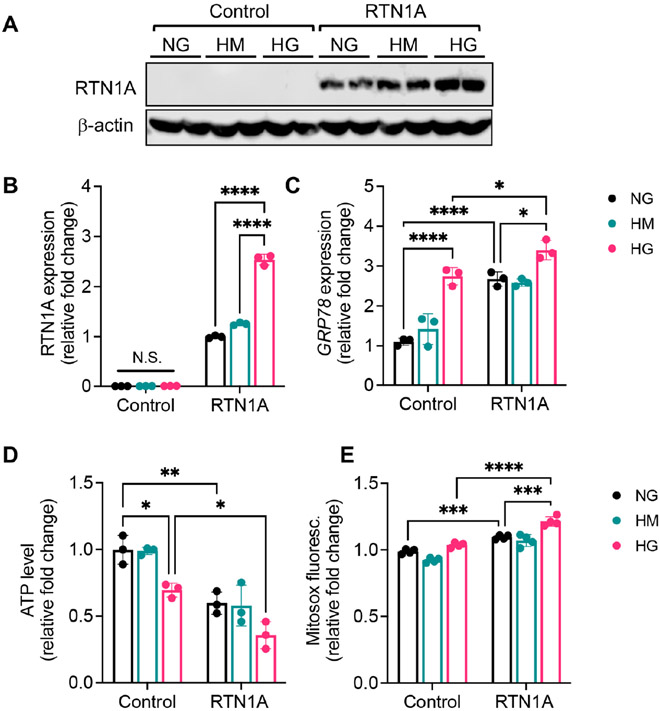
Figure 6: RTN1A enhances high glucose-induced ER stress and mitochondrial dysfunction in HK2 cells in high glucose conditions.
Control or RTN1A-overexpressing HK2 cells were incubated with media containing normal glucose (NG, 5mM), high mannitol (HM, 25mM+5mM glucose), or high glucose (HG, 30mM) for 24 hours. (A-B) Western blot analysis of RTN1A and densitometric analysis of RTN1A expression normalized to β-actin, shown as fold change to NG control. N.S., not significant. (C) Real-time PCR analysis of GPR78 expression in cells. (D) Average fold change in ATP levels. (E) Average fold change in MitoSOX signals. *p<0.05, **p<0.01, ***p<0.001, and ****p<0.0001 between indicated groups by two-way ANOVA with Tukey's post hoc analysis.

