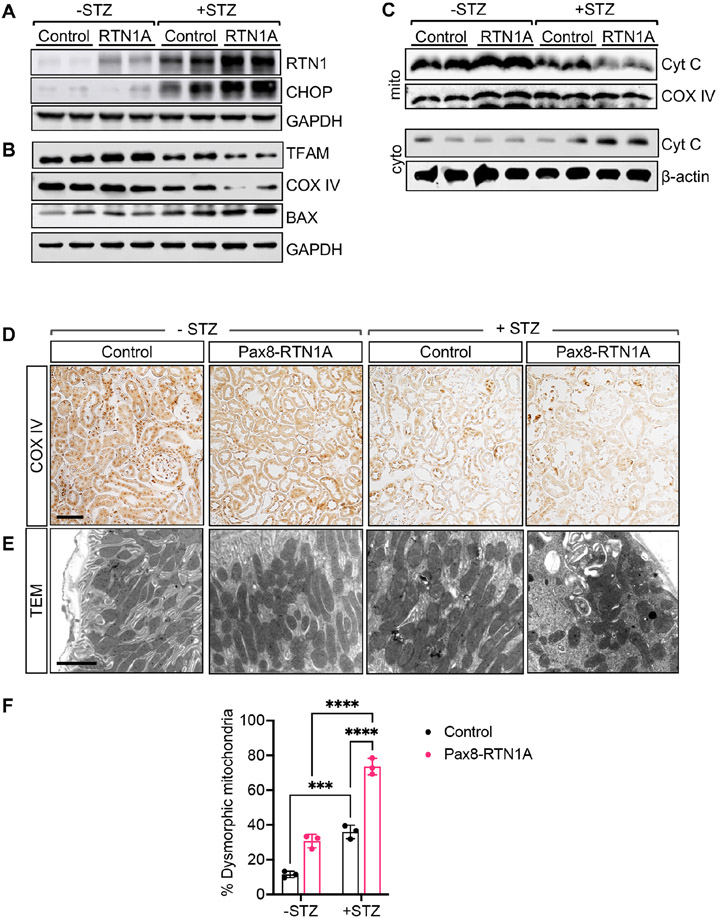
Figure 7: TEC-specific RTN1A overexpression exacerbates mitochondrial dysfunction in kidney cells in STZ-induced diabetic mice.
(A) Western blot analysis of RTN1A and CHOP in lysates of kidney cortices of control and diabetic mice. (B) Western blot analysis of BAX, TFAM, and COX IV in kidneys of control and diabetic mice. (C) Western blot analysis of cytochrome C in the mitochondrial (mito) and cytoplasmic (cyto) fractions of lysates of kidney cortices. Mitochondrial COX IV protein was used to normalize mitochondrial protein loading, and β-actin was used to normalize cytoplasmic protein loading. (D) Representative images of COX IV immunostaining in kidneys of mice. Some non-specific nuclear staining of COX IV was also noted in all samples. Scale bar, 30μm. (E) Representative images of transmission electron microscopy of mitochondria in TECs of mice. Scale bar, 2μm. (F) The quantification of the mitochondrial morphologic changes (n=3 mice per group, ***p<0.001 and ****p<0.0001 between indicated groups by two-way ANOVA with Tukey’s post hoc analysis.).

