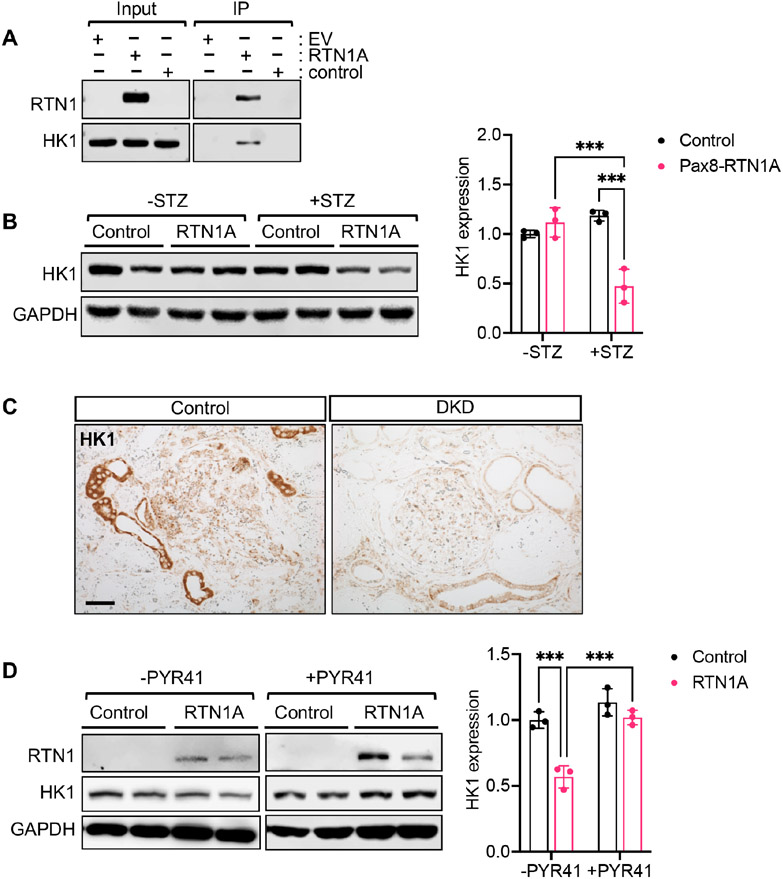
Figure 8: RTN1A interacts with HK1, and increased RTN1A is associated with reduced HK1 expression in DKD.
(A) Immunoprecipitation (IP) using FLAG-tagged RTN1A overexpressing HK2 cell lysates and western blot analysis using anti-FLAG and anti-HK1 antibodies. Input lysates are shown on the left. (B) Western blot analysis of RTN1A and HK1 expression in kidney cortices of control and diabetic mice. Densitometric analysis is shown on the right (n=3 mice per group). (C) Representative images of HK1 immunostaining in control or DKD biopsy sample. Scale bar, 50μm. (D) Western blot analysis of RTN1A and HK1 expression in HK2 cells with or without PYR41 treatment (25μM for 24 hours).

