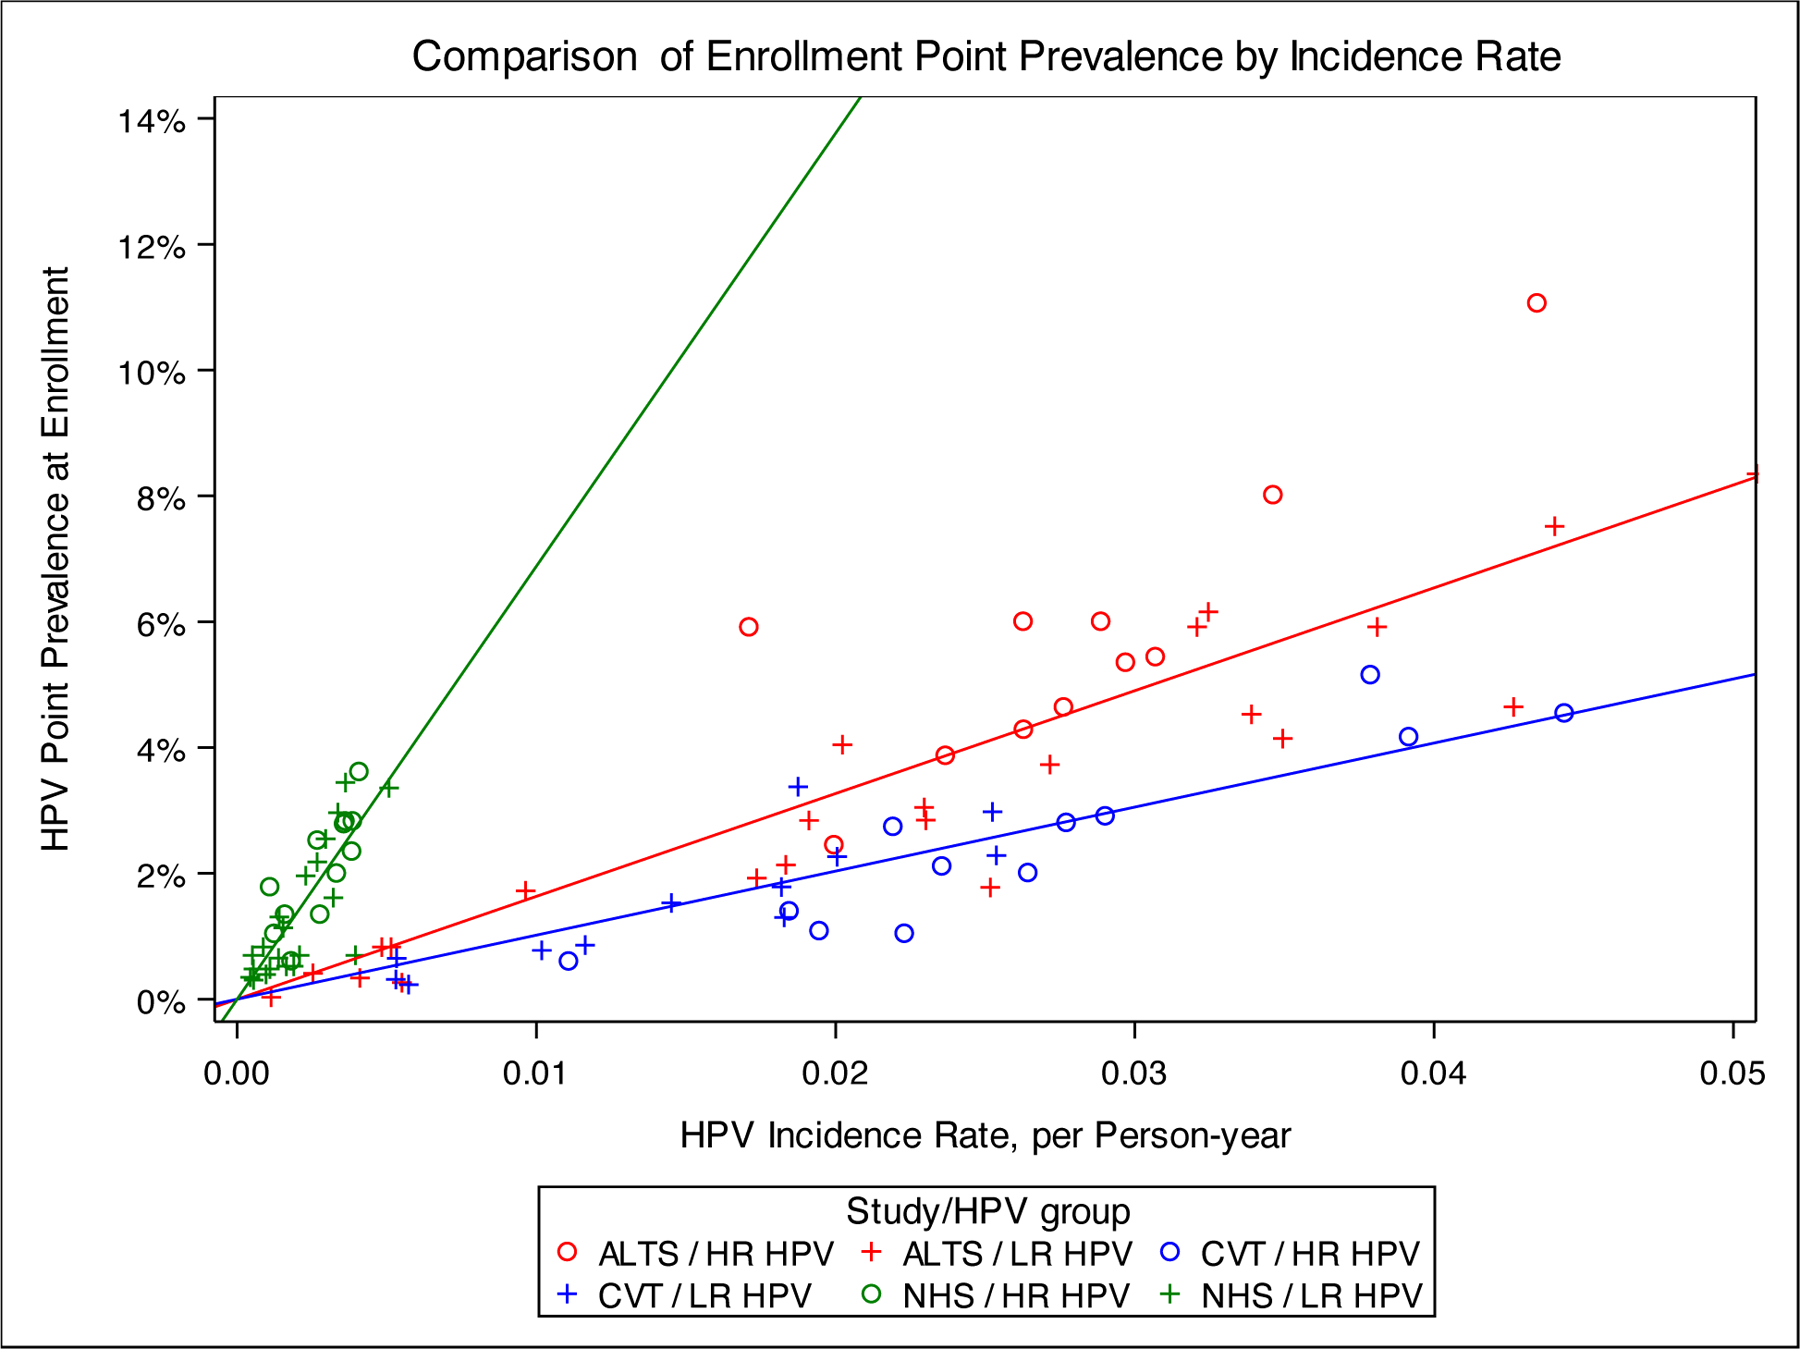
Figure 4.

Linear regression plots, type-specific HPV prevalence at enrollment by type-specific incidence rate. Plots display the linear regression of type-specific HPV prevalence at enrollment by type-specific incidence rate per 100 person-years for A) NHS population (slope=6.88); B) ALTS population (slope=1.63); and C) CVT Population (slope=1.02). Carcinogenic types are displayed in blue and non-carcinogenic types are displayed in red. Women with evidence of high-grade disease were excluded, as described in the methods.
