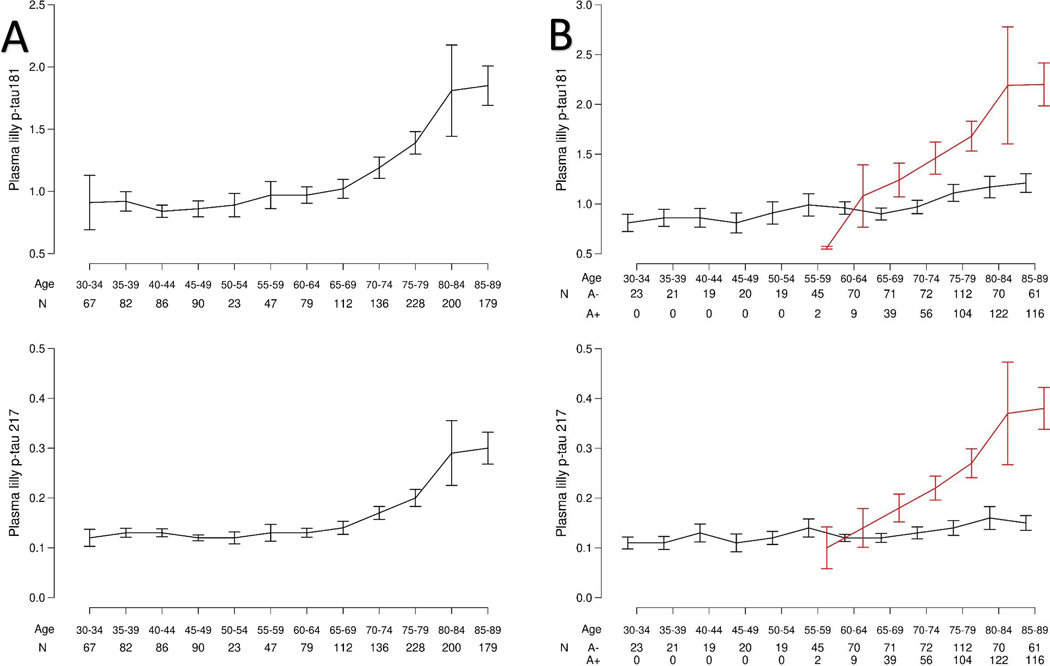
Fig. 1. Plasma P-tau181 and P-tau217 levels by age.
Fig. 1A shows the plasma P-tau181 and −217 levels by age alone. Fig. 1B shows the plasma P-tau181 and −217 levels by age and elevated brain amyloid based on PiB-PET>1.48 standard uptake value ratio. Black indicates A− and red indicates A+. Data are presented as mean values +/− Standard error of the mean (SEM).

