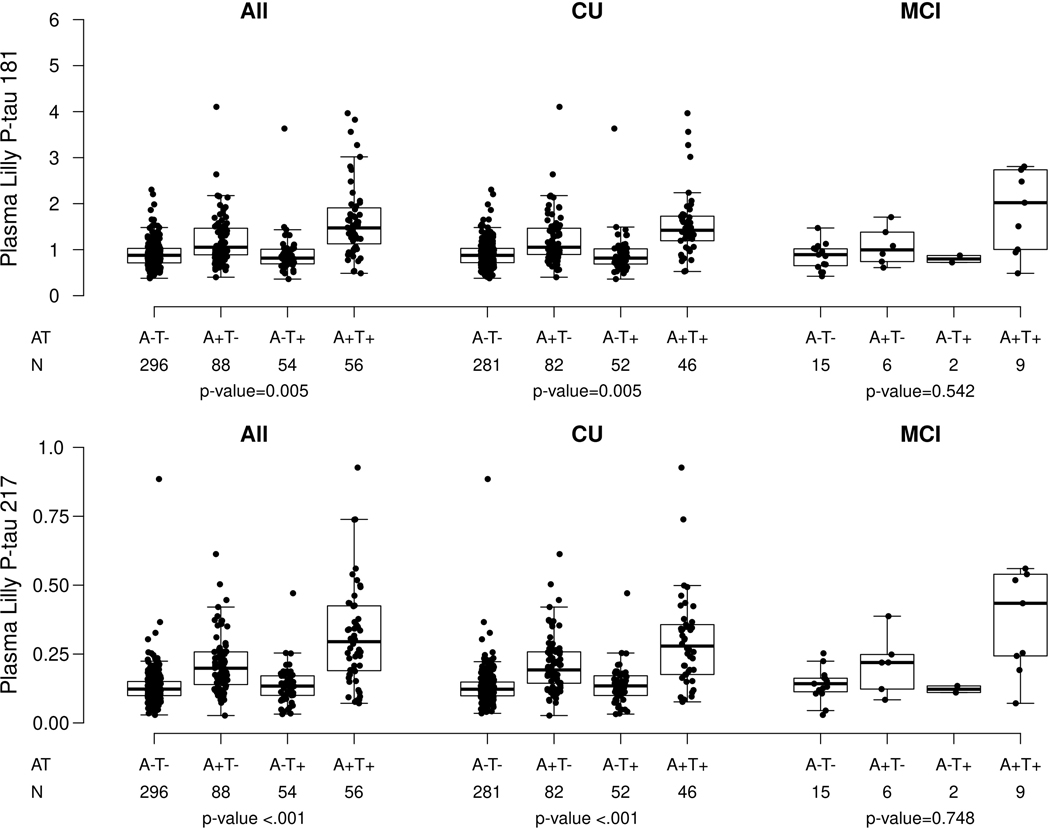
Extended Data Fig. 2. Plasma P-tau181 and P-tau217 levels by clinical diagnosis and amyloid and tau PET status.
Abnormal amyloid PET (A+) was defined as standard uptake value ratio (SUVR)>1.48 using PiB-PET. Abnormal tau PET (T+) meta region of interest (ROI) was defined as standard uptake value ratio (SUVR)≥1.29 using AV1451, and included the amygdala, entorhinal cortex, fusiform, parahippocampal, and inferior temporal and middle temporal gyri. P-values are from two-sided Kruskal-Wallis tests. Box plots display the median, 25th percentile, 75th percentile (middle, bottom, and top bars of the box), and the whiskers go out to 1.5 times the interquartile range (75th percentile – 25th percentile) from the 25th and 75th percentile. CU, cognitively unimpaired; MCI, mild cognitive impairment.

