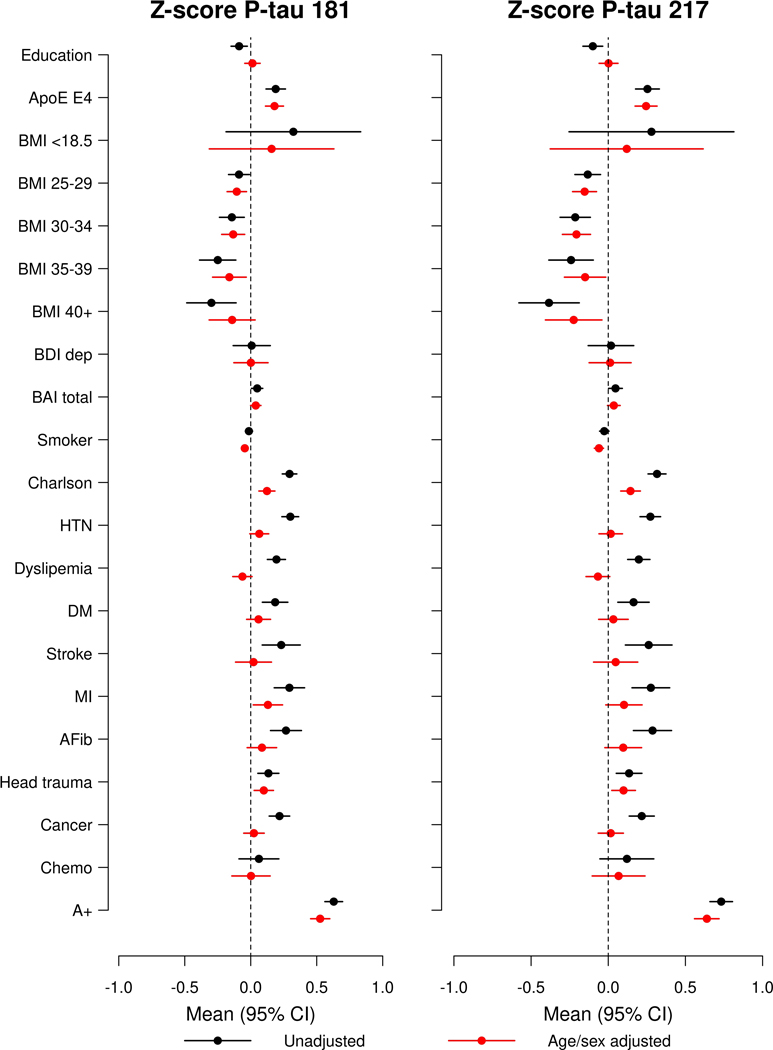
Extended Data Fig. 5. Forest plots of associations between multiple factors and plasma P-tau181 and P-tau217 levels using linear regression after excluding all participants with chronic kidney disease (N=1231).
Black lines indicate univariable associations and red lines indicate associations after adjustment for age and sex. Means and 95% confidence intervals are provided. A+, Elevated amyloid PET; AFib, atrial fibrillation; BAI total, Beck Anxiety Inventory; BDI dep, Beck Depression Inventory; BMI, body mass index; Chemo, chemotherapy for those with a cancer diagnosis; CKD, chronic kidney disease; DM, diabetes mellitus; HTN, hypertension; MI, myocardial infarction.

