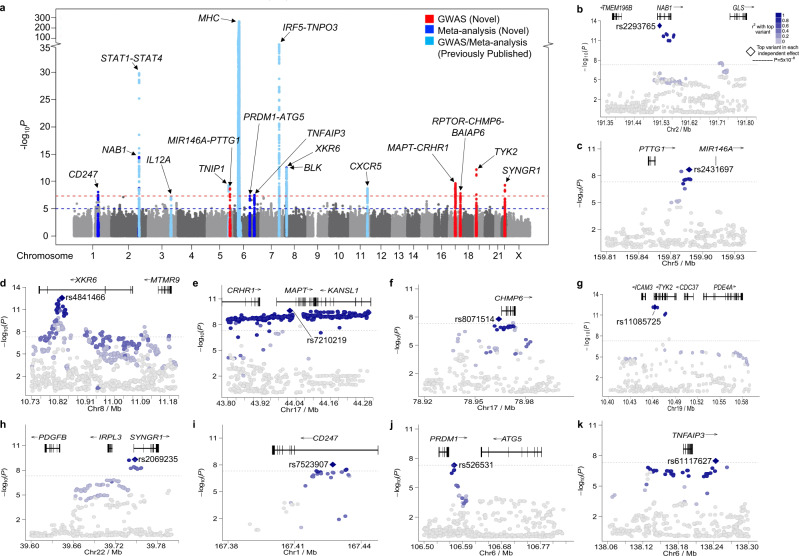
Fig. 2. Summary of the SNP-Sjögren associations in a European population.
a Manhattan plot shows the summary data from the meta-analysis of the 7.3 × 10⁵ SNPs shared between the GWAS and ImmunoChip dataset (Supplementary Data 1) after imputation. The −log10(P) for each variant is plotted according to chromosome and base pair position. A total of seven novel loci (indicated in red) exceeded genome-wide significance (GWS) of PGWAS < 5 × 10⁻⁸ (red dashed line). Three additional novel loci (indicated in royal blue) exceed GWS after meta-analysis (PMETA < 5 × 10⁻⁸). Several previously established loci were replicated (indicated in light blue). The suggestive GWAS and meta-analysis threshold (PSuggestive < 5 × 10⁻⁵) is indicated by the blue dashed line. b–h Logistical regression analysis was performed on GWAS dataset PI1 after imputation, identifying the top SNP associations (e.g., index SNPs) of the novel GWS regions of association: NAB1 (b), PTTG1-MIR146A (c), XKR6 (d), MAPT-CRHR1 (e), RPTOR-CHMP6-BAIAP6 (f), TYK2 (g), SYNGR1 (h). i–k Logistical regression analysis was performed after meta-analysis of the GWAS and ImmunoChip data, identifying the top SNP associations (e.g., index SNPs) of the novel GWS regions of association: CD247 (i), PRDM1-ATG5 (j), TNFAIP3 (k).

