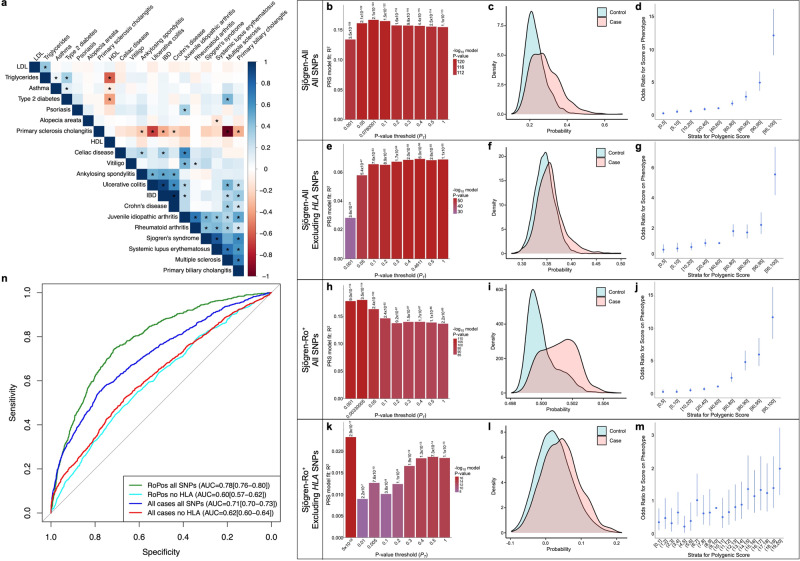
Fig. 3. Polygenic risk score analysis of the Sjögren-SNPs in all genotype Sjögren’s cases and Ro+ Sjögren’s cases with or without the HLA region.
a Heatmap of LDSC-estimated genetic correlations between Sjögren’s and 19 other immune-mediated diseases and other common traits using European GWAS summary data from the 1000 Genomes Project. Box color indicates magnitude of correlation; * indicates significant P-value after Bonferroni correction. b–m Polygenic risk scores (PRS) were calculated for all genotyped individuals from the Sjögren-All (b–g) or Sjögren-Ro+ (h–m) subsets, divided 2/3 into training and 1/3 into testing datasets, using LD-pruned genotyped SNPs (r2 > 0.2) including (b–d, h–j) or excluding (e–g, k–m) SNPs from the HLA region (6p21.3–22.3.). (b, e, h, k) Bar plot of multiple P-value thresholds (PT) for PRS prediction of Sjögren’s. c, f, i, l Histogram of the PRS distribution in Sjögren’s cases (orange) and controls (teal). d, g, j, m Strata plot of the odds ratio (OR) when comparing PRS from different quantile ranges. Bars indicate the 95% confidence intervals of the OR from each quantile range. n Area under the receiver operating characteristic curve (AUROC) values of PRS using LD-pruned genotyped Sjögren-SNPs including SNPs from 6p21.3–22.3 in all genotyped Sjögren’s cases (dark blue) or Ro+ Sjögren’s cases (green) relative to population controls, and LD-pruned genotyped Sjögren-SNPs excluding SNPs from 6p21.3–22.3 in all genotyped Sjögren’s cases (red) or Ro+ Sjögren’s cases (light blue) relative to population controls.

