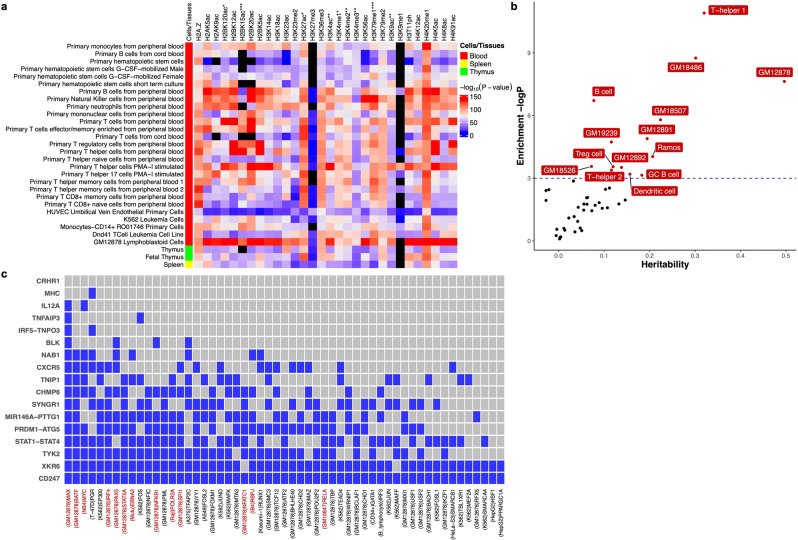
Fig. 4. Epigenetic and transcription factor enrichment analysis of Sjögren’s risk loci in specific cell types and tissues.
a Enrichment analysis of 30 histone marks in 127 different cell types and tissues from the Roadmap Epigenome Consortium Project was performed using GREGOR software. Heatmap displays the enrichment P-value for each histone mark plotted relative to specific immune cell types from the blood (red), spleen (yellow), and thymus (green). Black boxes indicate missing data. Complete analysis of all 127 cell types and tissues from the Roadmap Epigenome Consortium Project are reported in Supplemental Fig. 8 and Supplemental Data 3. b Enrichment of heritability in cell type-specific enhancers reported in the EnhancerAtlas2.0 database. Enrichment was calculated as partitioned heritability divided by the proportion of GWS Sjögren-SNPs that intersect with enhancer regions in each cell type. Cell types exhibiting significant GWS Sjögren-SNPs in enhancers are indicated in red. Blue dashed line is the threshold of significance after correction for multiple testing of P ≲ 0.05. c Enrichment of cell type-specific transcription factor binding sites. Transcription factors are indicated by a blue box if at least one Bonferroni-corrected (P ≲ 0.05) intersection between an indicated transcription factor and Sjögren-associated risk locus was detected. Red font indicates transcription factors that are also associated with the EBNA2 super enhancer. The cell type with the most significant interaction is listed in parentheses for each transcription factor.

