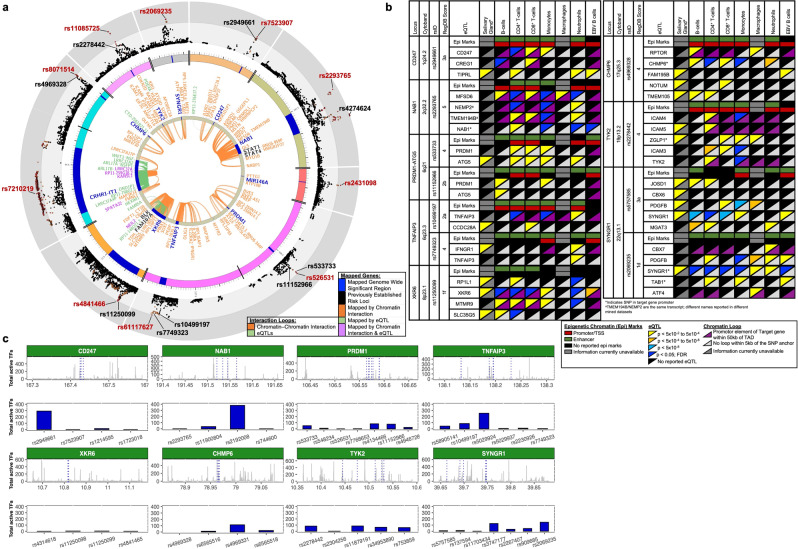
Fig. 5. Chromatin Interactions and eQTLs of the ten novel Sjögren-associated genetic risk loci.
a Circos plot shows the zoom regional Manhattan plots for each genetic risk locus (outer most layer); SNPs with P-value <0.05 (black); r2 > 0.08 (red); r2 > 0.06 (orange). Index SNP rsIDs are indicated in red. Black rsIDs are prioritized SNPs from the 95% credible set that are also eQTLs that exhibit chromatin-chromatin interactions and are shown in (b). Outer circle displays the chromosome coordinate with the genomic risk loci highlighted in blue. Genes that are eQTLs (green) or exhibit chromatin interaction by Hi-C in Epstein–Barr virus (EBV)-transformed B lymphocytes (orange) are reported on the inner circles as text or interaction links. Each index gene is colored blue. Genes that are eQTLs and engage in chromatin interactions are reported in purple. b Cell type-specific functional annotations (horizontal rectangles), select eQTLs (top triangles), and chromatin-chromatin interactions (bottom triangle) are shown for the indicated prioritized SNPs from each 95% credible set. MIR146A was omitted because mined eQTL databases did not test MIR146A. Complex linkage disequilibrium of the CRHR1 association impaired refinement and fine-mapping of the region. c IMPACT annotation of the most likely functional Sjögren-SNPs to quantify SNP position in 700 cell-type-specific active transcription factor binding sites. Top panel depicts SNP position (blue lines) relative to genomic coordinates (Mb) of each indicated locus. Bottom panel shows the total number of active transcription factor binding sites detected at each indicated SNP.

