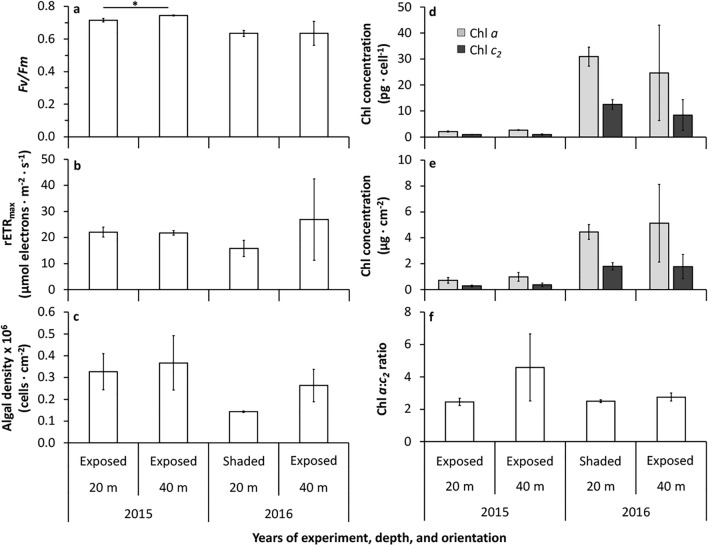
Figure 6.
Maximum quantum yield of Photosystem II (Fv/Fm) (a), rETRmax (b), algal density per surface area (c), chlorophyll (a and c2) per algal cell (d) and per surface area (e), and the ratio of chlorophyll a and c2 (f) of the surviving S. hystrix juveniles at the end of the experiment (after 6 months) in 2015 (20 and 40 m depth both in exposed orientation) and in 2016 (20 m shaded orientation and 40 m exposed orientation) (mean ± SE). The asterisk indicates a significant difference (p = 0.028).

