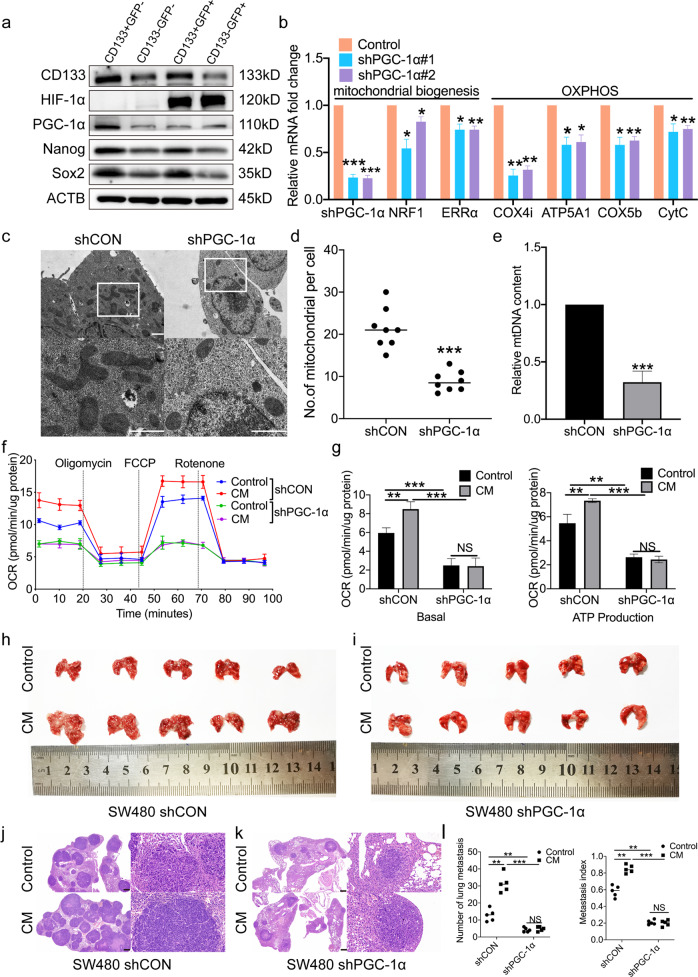
Fig. 5. PGC-1α regulates mitochondrial biosynthesis and OXPHOS of normoxic CSCs.
a Immunoblot analysis of CD133, Nanog, Sox2, HIF-1α, and PGC-1α in post-sorted SW480 cells. Cell hypoxia was induced under physical hypoxic conditions. Loading control was assessed by ACTB (i.e. β-actin). b RT-PCR analysis of mitochondrial biogenesis and oxidative phosphorylation genes expression in XhCRC normoxic sphere-forming cells infected by PGC-1α shRNA lentivirus or vector. c, d Electron microscopy of mitochondria number in SW480 sphere-forming cells infected by PGC-1α shRNA lentivirus or vector. Quantification of the number of mitochondria per cell in the imaged section (n = 8 cells) was shown in d. Scale bar: 1μm. e RT-PCR analysis of mitochondrial DNA content in SW480 sphere-forming cells infected by PGC-1α shRNA lentivirus or vector. f, g Seahorse analysis for oxygen consumption rate (OCR) of SW480 normoxic sphere-forming cells infected by. PGC-1α shRNA lentivirus or vector. Cells were treated with CM for 24 h, DMEM/F12 medium as control. Quantification of the Seahorse data was shown in g. h–l 1 × 10⁶ CD133+GFP− SW480 cells infected by PGC-1α shRNA lentivirus or vector were injected into tail vein of NOD/SCID mice (n = 5). CM treatment started 72 h pre-injection, DMEM/F12 medium as control. After 8 weeks, lung metastasis was determined. Representative images of lung metastasis were shown in h and i. H&E-stained lung sections were shown in j, k. Quantified analysis of metastatic lung nodules was shown in l. Scale bar: 500 μm. Data are expressed as mean ± SD. All in vitro experiments were repeated three times independently. *P < 0.05, **P < 0.01, ***P < 0.001.

