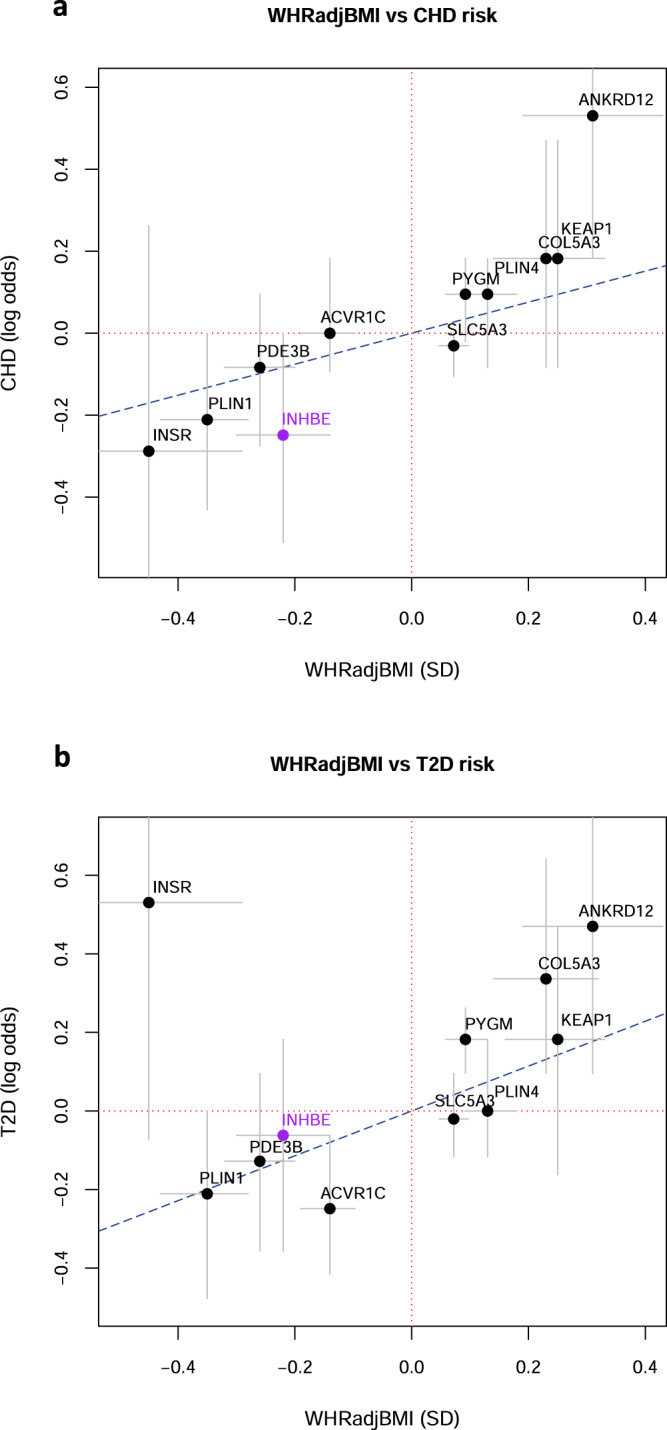
Fig. 3. Relationship between effect on WHRadjBMI and risk of CHD and T2D.

For significant genes, we plotted the estimated log odds of disease risk as a function of the estimated effect in standard deviations (SD) on WHRadjBMI calculated in 362,679 European ancestry participants. Effects are shown for INHBE pLOF and, for the other genes, the most significant variant set per gene. a Effect on WHRadjBMI (in SD) versus the log odds of CHD (b) Effect on WHRadjBMI (in SD) versus the log odds of T2D. Grey bars represent the 95% confidence interval. The blue dotted line represents the estimated effect on disease predicted by a MR study of WHRadjBMI1.
