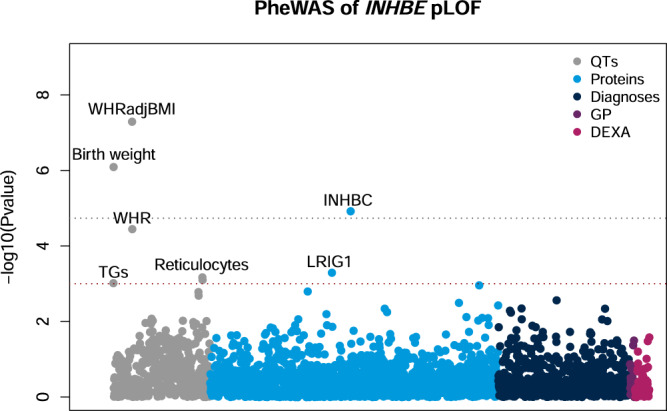
Fig. 4. PheWAS of INHBE pLOF.

The association of INHBE pLOF with quantitative traits (QTs), circulating proteins (Proteins), disease diagnoses (Diagnoses), biomarkers from primary care (GP) and measures of body composition (DEXA) was tested using either a generalized linear regression or a mixed-effects model. The y-axis shows −log10(P) for each trait tested. Phenome-wide significant (P ≤ 1.84 × 10⁻⁵ Bonferroni correcting for the number of phenotypes tested; grey line) and suggestive (P ≤ 1 × 10⁻³; red line) associations are labeled. TGs; triglycerides, Reticulocytes; high light scatter reticulocyte count and percentage, INHBC; inhibin βC/activin C, LRIG1; leucine-rich repeats and immunoglobulin-like domains protein 1.
