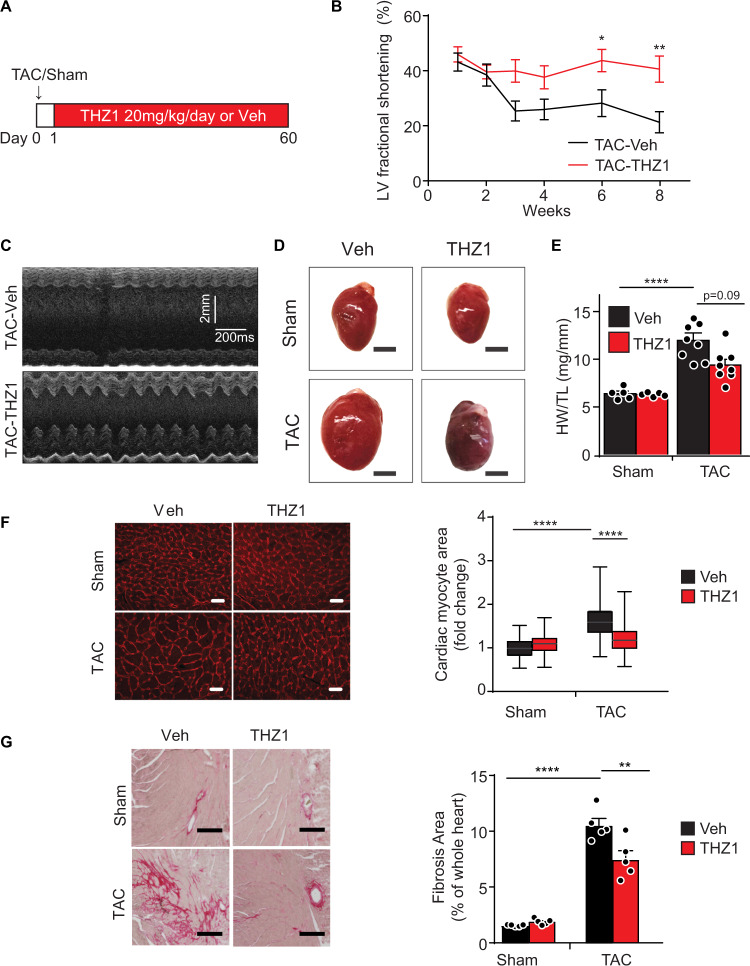
Fig. 3. THZ1 ameliorates cardinal features of adverse cardiac remodeling and HFrEF pathogenesis in mice.
A Schema of the experimental design. B Two-dimensional echocardiographic quantification of left ventricle area fractional shortening in indicated groups (n = 8). Echocardiography for the sham groups (Sham-Veh and Sham-THZ1) were performed at the end of the study (week 8) and are plotted alongside the week 8 TAC data in Supplementary Fig. 4A–C. *p = 0.0339, **p = 0.0039. Two-way ANOVA with Holm–Sidak multiple comparisons correction was used for statistical analysis. C Representative M-mode echocardiographic images obtained at mid-papillary muscle level from parasternal short-axis view (8 weeks post-TAC). D, E Representative heart images and quantification of heart weight/tibial length (HW/TL) ratio at 8 weeks post-TAC. Scale bar: 3 mm. F Representative images of myocardium visualized by wheat germ agglutinin staining (red) and quantification of cardiomyocyte cross-sectional area in indicated groups at 8 weeks post-TAC (pooled analysis of 150 individual cardiomyocytes randomly selected from hearts of 3 independent animals per experimental condition). Scale bar: 20 μm. Data presented as standard box-and-whisker plots showing median cardiomyocyte area (horizontal line). Upper and lower quartiles are designated by the box and whiskers designate upper and lower extremes. G Representative heart cross sections stained with picrosirius red with quantification of fibrosis area in indicated groups (n = 5; 8 weeks post-TAC). **p = 0.0027. Scale bar: 200 μm. *p < 0.05, **p < 0.01, ***p < 0.001, ****p < 0.0001 for all indicated comparisons. Data are shown as means ± SEM unless otherwise noted. One-way ANOVA with Tukey’s multiple comparisons test was used for all statistical analyses unless noted. Exact p values are noted when possible. Source data are provided as a Source Data file.

