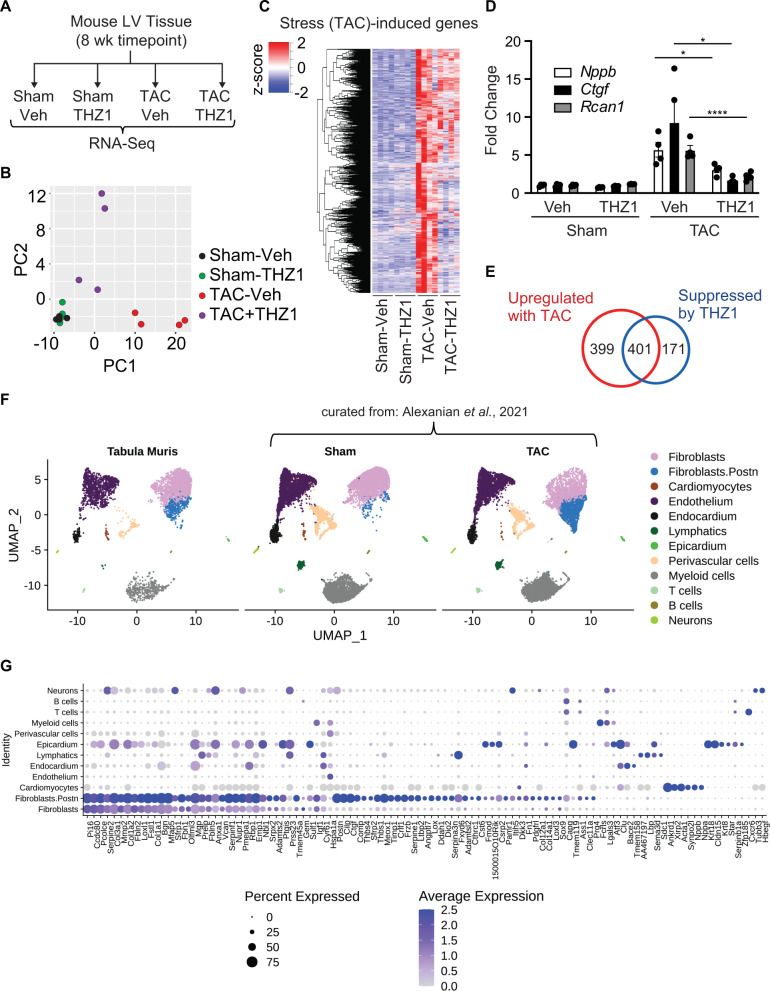
Fig. 4. THZ1 ameliorates specific pathological gene programs in diverse cardiac cellular compartments in failing mouse hearts.
A Schema of the experimental design. B Principal component (PC) analysis showing global gene expression in indicated samples. C A heatmap showing clustered, row-normalized stress-induced gene expression profile in each sample in indicated group (n = 4). D Gene expression levels of indicated representative genes (n = 4) calculated from normalized DeSeq2 counts. Significance levels were based on the adjusted p-values reported by DeSeq2. Bars denote mean ± SD. *p = 0.0171 for Nppb: TAC-Veh vs TAC-THZ1, *p = 0.0178 for Ctgf: TAC-Veh vs TAC-THZ1. E Venn diagram demonstrating number of differentially expressed genes in each indicated compartment (cutoffs are specified in Methods section). *p < 0.05, ****p < 0.0001 for all indicated comparisons. F UMAP (Uniform Manifold Approximation and Projection) projection of cardiac cell compartments in mouse heart identified by integrating two public mouse heart datasets (n = 32,407 cells). Each dot represents a single cell. Different cell-type clusters are color-coded. G Gene expression distribution of cell-type enriched genes whose expression is increased with TAC and suppressed by THZ1 (in E) across cell compartments in adult mouse heart. Genes that were induced with TAC and suppressed by THZ1, as determined by bulk RNA sequencing, were cross-referenced with the integrated single cell dataset (in F) to determine the most likely cell-type compartment from which each transcript originated. The size of the dot indicates the percentage of cells with at least one compartment-defining transcript detected and the color of the dot represents the scaled average expression level of expressing cells. Representative heatmaps for differentially expressed genes emanating from each identified cell compartment are shown in Supplementary Fig 6. One-way ANOVA with Tukey’s multiple comparisons test was used for all statistical analyses. Exact p values are noted when possible. Source data are provided as a Source Data file.

