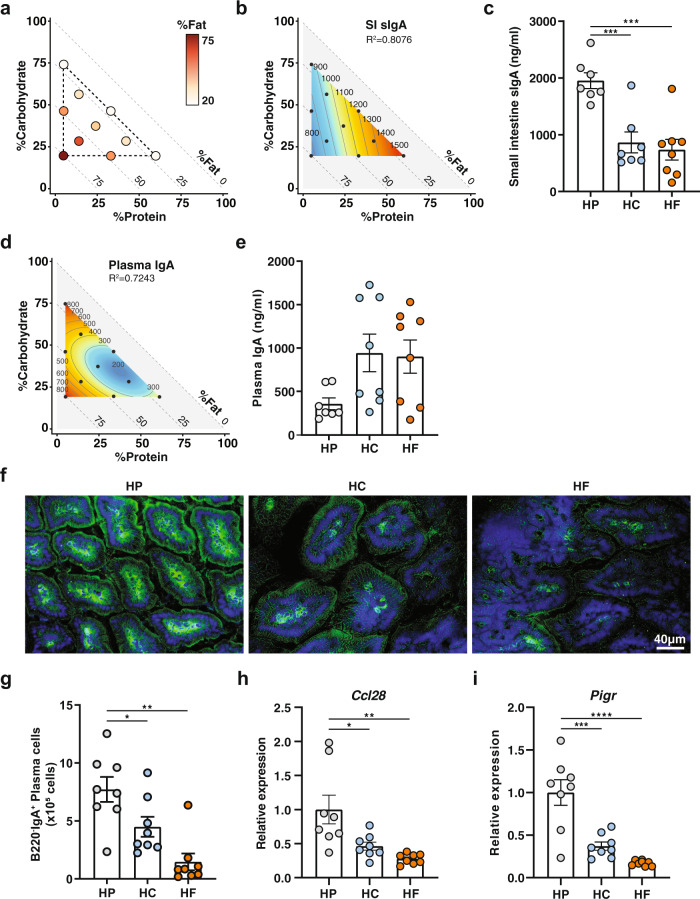
Fig. 1. High protein feeding promotes high lamina propria IgA production and higher luminal sIgA.
Animals were fed one of ten isocaloric diets encompassing a macronutrient range of protein (5–60%), carbohydrate (20–75%), and fat (20–75%) for 6 weeks. a Visual representation of the composition of the diets used in this study. Each diet is represented by one circle each and their localisation on the x axis and on the y axis define their proportion of protein and of carbohydrate, respectively. The proportion of fat is indicated by the colour range as illustrated in the legend. b Contribution of macronutrient composition to small intestinal luminal sIgA (n = 7–8 per diet, quantified by ELISA) was modelled by mixture model and represented on a right-angled mixture triangle comprising of carbohydrate (y axis), protein (x axis) and fat (hypotenuse) with small intestinal content IgA concentration (ng/ml, numbers on isolines) as the response variable. Red represents high levels of sIgA while blue represents low levels of sIgA in the nutrient mixture space. Each dot represents one of the 10 diets used for modelling response surface. c Scatter bar plot of sIgA from mice fed on a high-protein (HP), high-carbohydrate (HC) or high-fat (HF) diet as determined by ELISA (n = 7 or n = 8 mice per diet for HP/HC and HF diet respectively; HP vs. HC p = 0.0009, HP vs. HF p = 0.0002). d Mixture model of plasma IgA represented on a right-angled mixture triangle and (e) corresponding scatter bar plot (n = 7 or n = 8 mice per diet for HP, and HC/HF diet respectively). f Representative immunofluorescence staining of IgA (green) in the small intestine counterstained with DAPI (blue) from mice fed on an HP, HC, or HF diet for 5 weeks. The scale bar represents 40 µm. g Total number of B220−IgA+ IgA plasma cells in the small intestine lamina propria as determined by flow cytometry (n = 8 mice per group; HP vs. HC p = 0.0489, HP vs. HF p = 0.0002). h, i Gene expression of (h) Ccl28 (HP vs. HC p = 0.0187, HP vs. HF p = 0.0017) and (i) Pigr (HP vs. HC p = 0.0002, HP vs. HF p = <0.0001) in whole small intestine tissue was determined by qPCR from mice fed on either a HP, HC, or HF diet (n = 8 mice per group). Data are represented as mean ± SEM. Results represent n = 2 (e–i) and n = 3 independent experiments (c). *p < 0.05, **<0.01, ***<0.001, ****<0.0001 by ordinary one-way ANOVA followed by Tukey’s multiple comparisons test.

