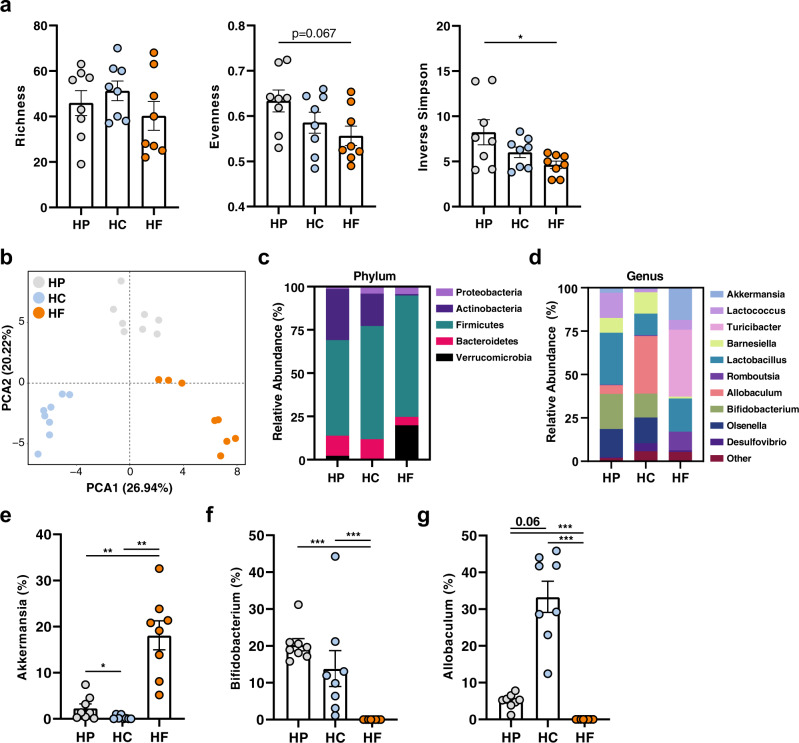
Fig. 4. Dietary intervention significantly affects the small intestine microbiota composition.
Mice were fed on either a high-protein (HP), high-carbohydrate (HC), or high-fat (HF) diet for 6 weeks and DNA was extracted from small intestinal content for 16 S rRNA gene sequencing (n = 8 mice per diet). Diversity of the small intestinal microbiome was determined by a Richness, Evenness and Inverse Simpson Index (HP vs. HF p = 0.0269) with *p < 0.05 by ordinary one-way ANOVA followed by Tukey’s multiple comparisons test. b Differences in the structure of the small intestinal microbiota communities were determined by principal component analysis (PCA) of Aitchison’s distance (Euclidean distance of centre-log transformed counts). Relative abundance of bacteria in the small intestine is represented at the c phylum and d genus level (showing only the top 10 genera). Relative abundance of (e) Akkermansia (HP vs. HC p = 0.032/p = 0.013, HP vs. HF p = 0.002/p = 0.003, HC vs. HF p = 0.002/p = 0.003), f Bifidobacterium (HP vs. HF p = <0.0001/p = 0.001, HC vs. HF p = <0.0001/p = 0.001), and (g) Allobaculum (HP vs. HF p = <0.0001/p = 0.001, HC vs. HF p = <0.0001/p = 0.001) with, **<0.01, ***<0.001 by Aldex2 test (Welch’s t test/Wilcoxon test with Benjamini–Hochberg corrected false discovery rate). Data are represented as mean ± SEM.

