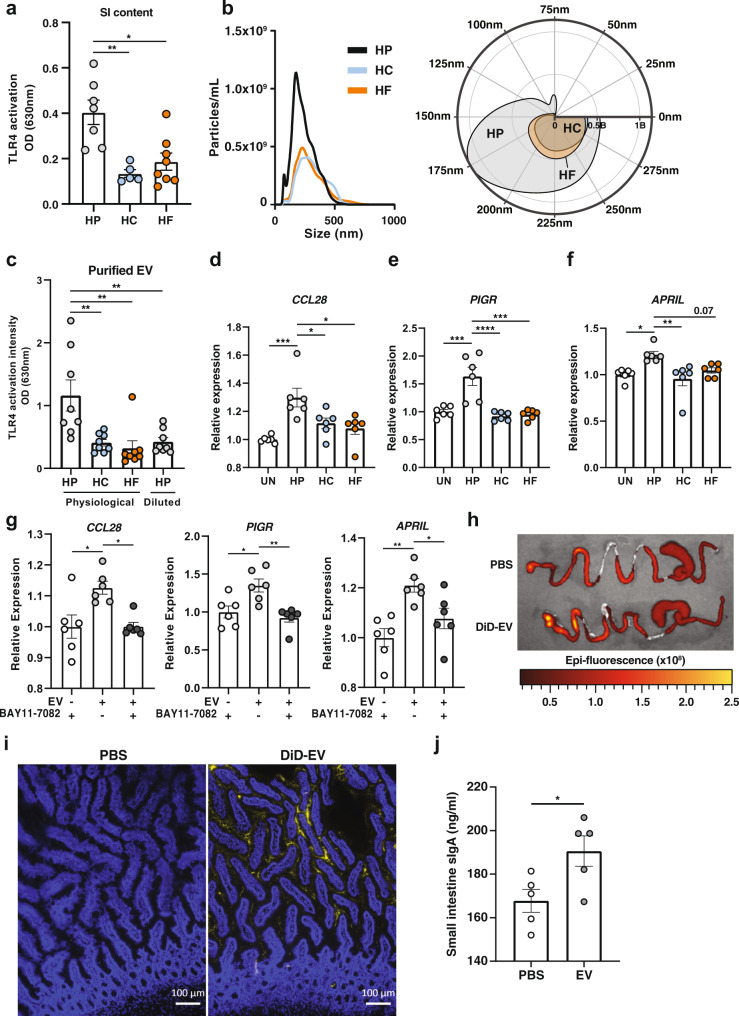
Fig. 5. EV derived from high protein-fed microbiota activate epithelial TLR4 and promote the expression of PIGR and APRIL.
Mice were fed on either a high-protein (HP), high-carbohydrate (HC) or high-fat (HF) diet for 6 weeks. a Small intestinal content (diluted at 1:200) (n = 5 and n = 8 mice per diet for HP/HC and HF diet, respectively) was incubated overnight with HEK-TLR4 cell line and TLR4 activation was quantified at 630 nm. (HP vs. HC p = 0.0017, HP vs. HF p = 0.0038). b Small intestine microbiota-derived EV were characterised by Nanoparticle Tracking Analysis (n = 2 per diet pooled from n = 4 mice each) and represented as an XY plot (left): 0–500 nm vs. particle number/mL), or polar plot (right): angular axis represents particle size between 0 and 300 nm and radial axis represents particle number/mL). c Small intestine microbiota-derived extracellular vesicles (EV) were incubated at physiological ratio (~2:1:1 of HP:HC:HF), or at 1:1:1 ratio (HP diluted) overnight with the HEK-Blue TLR4 cell line and TLR activation measured at 630 nm (n = 8 mice per condition; HP vs. HC p = 0.0058, HP vs. HF p = 0.0019, HP vs. HP diluted p = 0.007). d–f HT-29 were stimulated with small intestine microbiota-derived EV isolated from HP (2 × 10⁹ EV per well) or HC/HF (1 × 10⁹ EV per well) fed animals for 16 h and expression of d CCL28 (Un vs. HP p = 0.0006, HP vs. HC p = 0.0372, HP vs. HF p = 0.0105), e PIGR (Un vs. HP p = 0.0003, HP vs. HC p = <0.0001, HP vs. HF p = 0.0001) and f APRIL (Un vs. HP p = 0.0165, HP vs. HF p = 0.0036) were quantified by qPCR (n = 6 wells per condition). g HT-29 cells were incubated with 2 × 10⁹ small intestine microbiota-derived EV from HP-fed animals for 16 hours in the presence or absence of 10 µM of NF-κB inhibitor BAY11-7082, or BAY11-7082 alone and expression of CCL28 (−EV + BAY11-7082 vs. +EV-BAY11-7082 p = 0.0103, +EV-BAY11-7082 vs. +EV + BAY11-7082 p = 0.0106), PIGR (−EV + BAY11-7082 vs. +EV-BAY11-7082 p = 0.0131, +EV-BAY11-7082 vs. +EV + BAY11-7082 p = 0.0032) and APRIL (−EV + BAY11-7082 vs. +EV-BAY11-7082 p = 0.0021, +EV-BAY11-7082 vs. +EV + BAY11-7082 p = 0.0443) were quantified by qPCR (n = 6 wells per condition). h Representative ex vivo epi-fluorescence imaging of gastrointestinal tract 6 hours post-oral administration of DiD-stained EV or PBS. i Presence of DiD-EV (yellow) and DAPI (blue) were assessed by fluorescent microscopy from sections of small intestine isolated from mice 6 hours after oral administration, with PBS as control. Scale bar represents 100 µm. j Mice were intragastrically administered with 1–3 × 10¹⁰ EV daily for 5 weeks and small intestine sIgA quantified by ELISA (n = 5 mice per group; p = 0.0319 by two-tailed unpaired t test). Data are represented as mean ± SEM. Results represent n = 2 independent (a–h) and n = 1 independent experiment (i, j). *p < 0.05, **<0.01, ***<0.001, ****<0.0001 by ordinary one-way ANOVA followed by Tukey’s multiple comparisons test unless otherwise stated.

