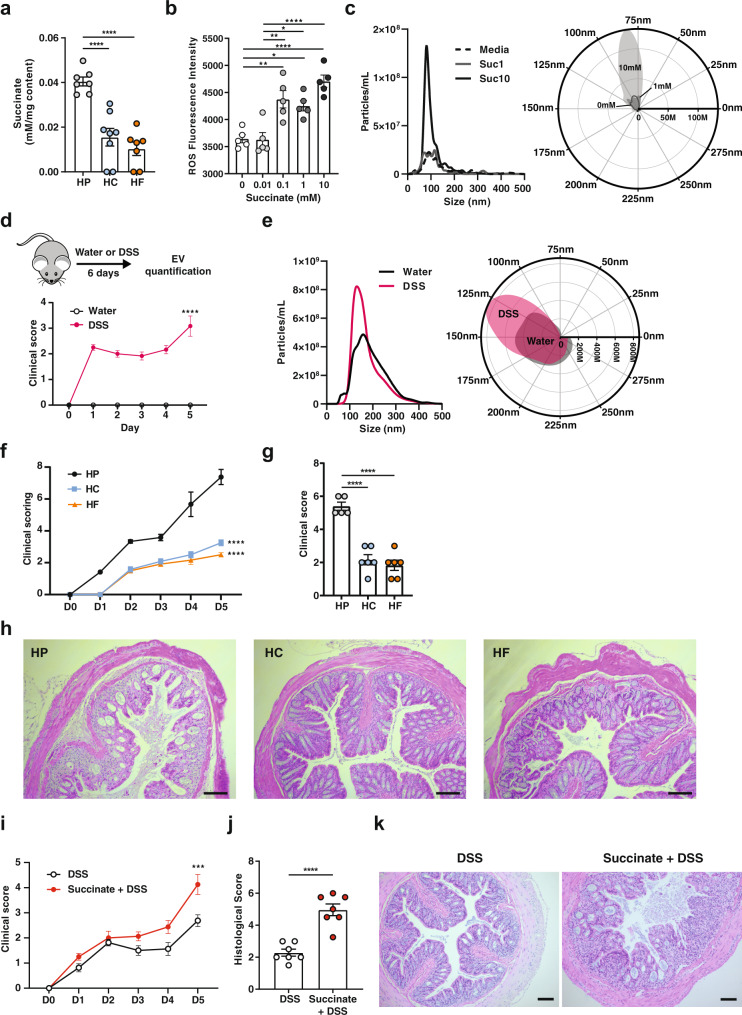
Fig. 6. Succinate promote bacterial ROS and bacterial EV production and is associated with worse DSS-induced colitis.
a The concentration of succinate in the small intestine luminal content of mice fed on a high-protein (HP), high-carbohydrate (HC) or high-fat (HF) diet for 6 weeks was quantified by NMR spectroscopy (n = 7 and n = 8 mice per diet for HP/HF and HC group respectively; HP vs. HC p = <0.0001, HP vs. HF p = <0.0001). b E. coli were grown in the presence of increasing concentration of succinate (0–10 mM) for 2 h and ROS production quantified by the conversion of 2’,7’-dichlorofluorescein diacetate to 2’,7’-dichlorofluorescein (n = 5 independent culture per condition; 0 vs. 0.1 mM p = 0.0026, 0 vs. 1 mM p = 0.0131, 0 vs 10 mM p = <0.0001, 0.01 vs. 0.1 mM p = 0.0021, 0.01 vs. 1 mM p = 0.0108, 0.01 vs. 10 mM p = <0.0001). c E. coli was grown in the presence of succinate (0, 1, or 10 mM) for 16 h and extracellular vesicles (EV) isolated and quantified by NTA (n = 5–6 per condition) and represented as XY plot (left): 0–500 nm vs. particle number/mL or polar plot (right): angular axis represents particle size between 0 and 300 nm and radial axis represents particle concentration in number/mL. d Mice received 3% DSS in drinking water for 6 days (upper) and colitis development was scored daily (lower) (n = 6 mice per group; p = <0.0001 by two-way ANOVA) and (e) at endpoint, faecal EV were isolated and quantified by Nanoparticle Tracking Analysis (n = 6 mice per condition) and represented as an XY plot (left): 0–500 nm vs. particle number/mL, or polar plot (right): angular axis represents particle size between 0 and 300 nm and radial axis represents particle concentration in number/mL. f–h Mice were mice fed on a HP, HC, or HF diet for 6 weeks before induction of DSS colitis (3% DSS in drinking water for 6 days) and (f) clinical colitis development was scored daily (HP vs. HC p = <0.001, HP vs. HF p = <0.0001) and g colonic histological score assessed (HP vs. HC p = <0.0001, HP vs. HF p = <0.0001) and h representative haematoxylin and eosin-stained colonic sections (n = 6 mice per group). i–k Mice were administered 100 mM pH-adjusted succinate in drinking water for 3 weeks before induction of DSS colitis (3% DSS in drinking water for 6 days) and i clinical colitis development was scored daily (p = 0.0005 by two-way ANOVA) and j histological scores quantified at endpoint on colonic section (p = <0.0001 by two-tailed unpaired t test) with k representative haematoxylin and eosin-stained colonic sections shown. (n = 7 mice per group). Scale bar represents 100 µm. Data are represented as mean ± SEM. Results represent n = 3 independent (b), n = 2 (b–e) and n = 1 independent experiments (f–k). *p < 0.05, **<0.01, ***<0.001, ****<0.0001 and were analysed by ordinary one-way ANOVA followed by Tukey’s multiple comparisons test unless otherwise stated.

