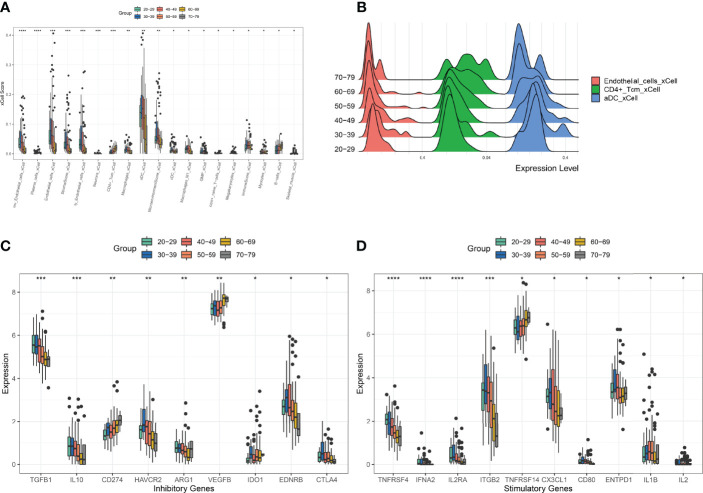
Figure 2.
Comparison of XCELL scores of ovarian tissues. (A) Cell types with significant differences. (B) Distribution of Endotheial cells, CD4+ Tcm, aDC in the six age groups. (C) Comparison of immune-inhibitory checkpoint gene expression. (D) Comparison of gene expression in immune-stimulatory checkpoints. *p < 0.05, **p < 0.01, ***p < 0.005, ****p < 0.001.

