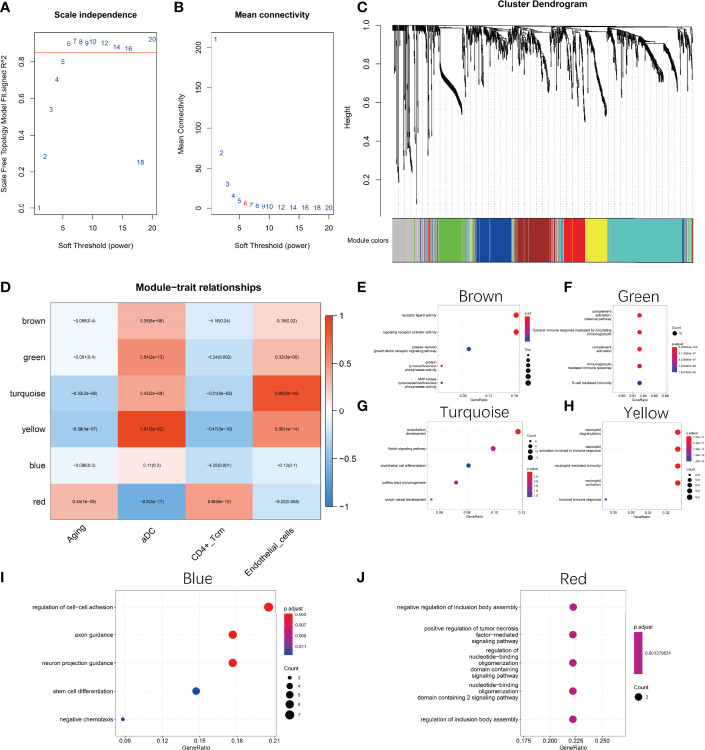
Figure 3.
Weighted gene co-expression network analysis (WGCNA). (A, B) Selection of the best soft threshold. (C) Six co-expression modules were obtained for genes with fusion distance less than 0.25. Among them, the grey modules contained genes that could not be clustered. (D) Correlation of modules with phenotypes. (E) Functional enrichment analysis of Brown module hub genes (F) Functional enrichment analysis of Green module hub genes (G) Functional enrichment analysis of Turquoise module hub genes (H) Functional enrichment analysis of Yellow module hub genes (I) Functional enrichment analysis of Blue module hub genes (J) Functional enrichment analysis of Red Module hub genes functional enrichment analysis. The hub genes of each module are selected based on MM values greater than 0.7.

