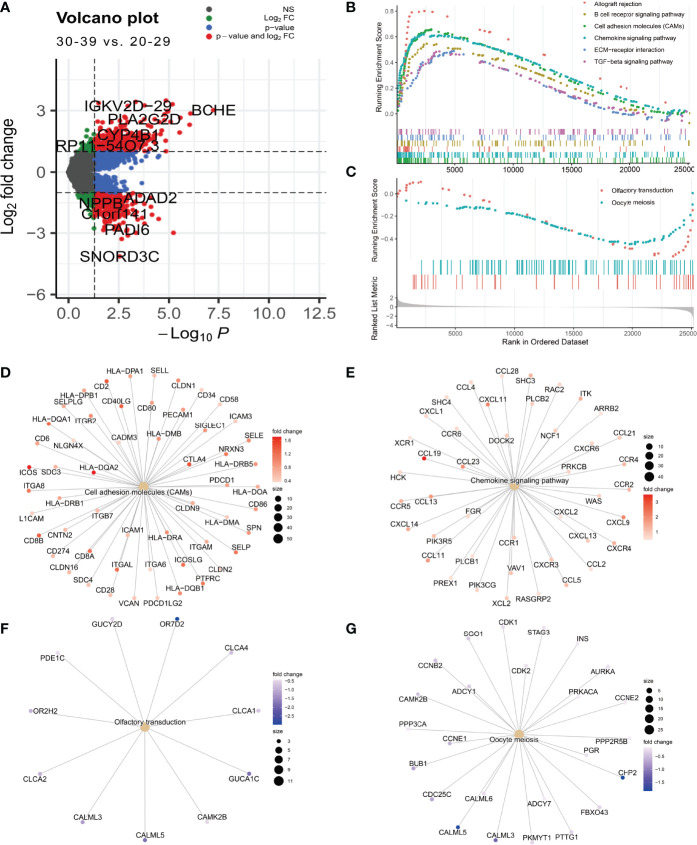
Figure 5.
Differential expression analysis of the 0-29 age group and the 30-39 age group. (A) Differential expression volcano plot (B) Signaling pathways enriched in the 30-39 age group (C) Signaling pathways enriched in the 20-29 age group. (D) Cell adhesion moleculars (CAMs) coregulated genes. (E) Chemokine signaling pathway coregulated gene. (F) Olfactory transduction coregulator gene (G) Oocyte meiosis coregulator gene.

