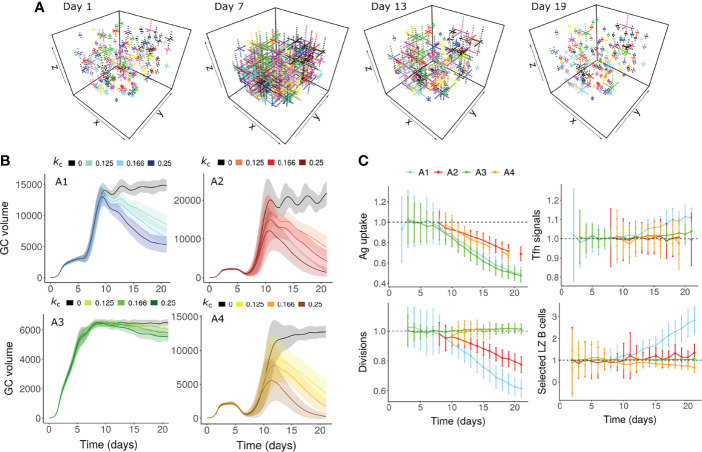
Figure 2.
GC shutdown due to contraction of FDCs (Mechanism 3). (A) Visualization of the FDC network in a GC simulation at 4 different time points (Days 1, 7, 13 and 19). In this representative simulation, assumption A1 ( Table 1 ) was used with an FDC contraction rate k c of 0.166 µm per hour. Each lattice site occupied by the FDC is shown as a dot. Soma and dendrites belonging to the same FDC are shown in the same color. (B) GC dynamics with assumptions A1-A4. Black curves represent control simulations. Different colors represent different rates of FDC contraction k c as shown in the labels above panel (B) Solid lines and shaded regions represent mean and standard deviation of 50 simulations, respectively. (C) Average antigen uptake per B cell, Tfh signals acquired per B cell, number of divisions of recycling GC B cells and fraction of Tfh selected LZ B cells. Readouts were normalized with that of the control simulation. Colors represent the assumptions A1-A4. Error bars represent standard deviation of 50 simulations. An FDC contraction rate of 0.166 µm per hour was used in panel (C) In all the panels, FDC extension rate was 0.166 µm per hour. GC, Germinal center; FDC, Follicular Dendritic Cell; Tfh, T follicular helper cell; Ag, Antigen; LZ, Light Zone.

