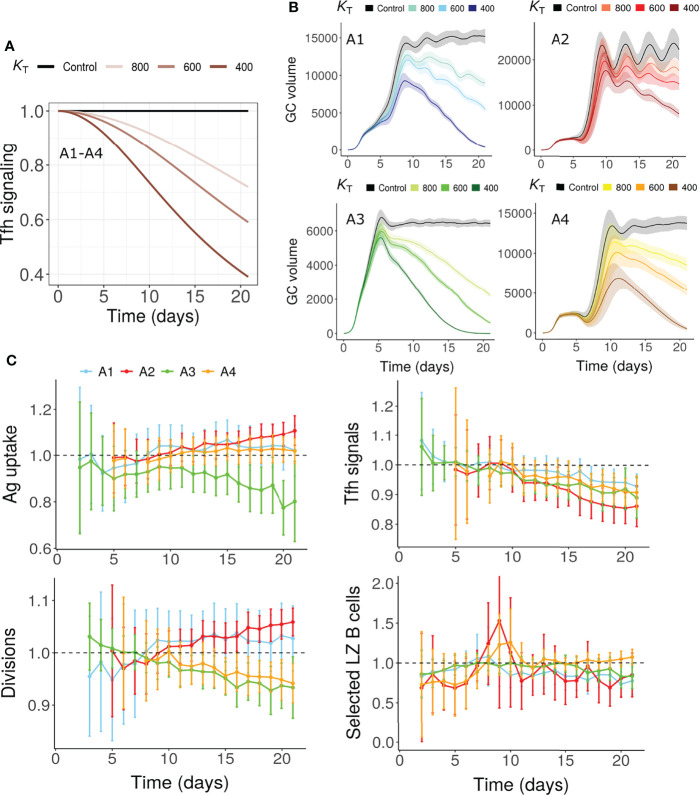
Figure 3.
GC shutdown due to changes in Tfh signaling intensity (Mechanism 5). (A) Maximum Tfh signaling intensity T max vs time according to Equation 8 in assumptions A1-A4. Values were normalized to the maximum signaling intensity at the start of the simulation. Colors represent different values of K T and black curve labelled control represents the control simulation where no decrease in Tfh signaling intensity was considered. K T is the time point in hours where the maximum Tfh signaling intensity decreases to half of its initial value (see Equation 8, Methods sections). (B) GC dynamics in assumptions A1-A4. Black curves represent control simulations. Different colors represent value of K T used in Equation 8 and are shown in labels above panel (B) Solid lines and shaded regions represent mean and standard deviation of 50 simulations, respectively. (C) Average antigen uptake per B cell, Tfh signals acquired per B cell, average number of divisions per recycling GC B cell and fraction of Tfh selected centrocytes (with K T = 600). Readouts were normalized with that of the control simulation. Colors represent the assumptions A1-A4. Error bars represent standard deviation of 50 simulations. GC, Germinal center; Tfh, T follicular helper cell; Ag, Antigen; LZ, Light Zone.

