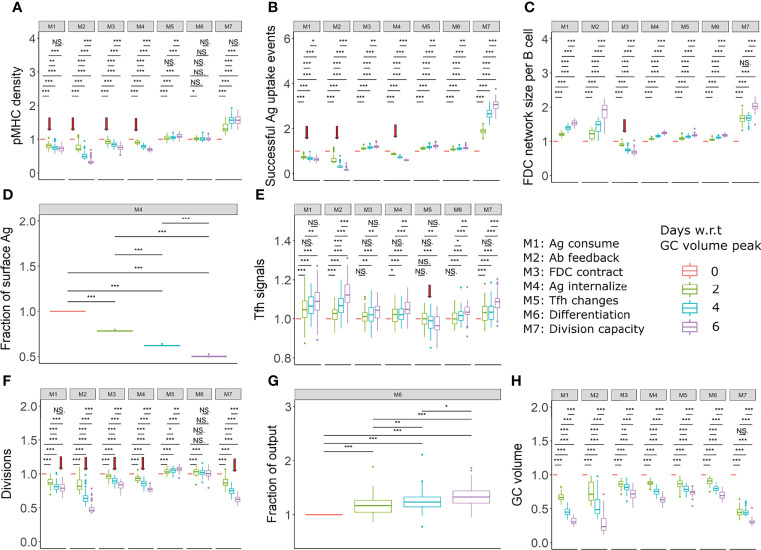
Figure 6.
Proposed experiments to identify the existence of mechanisms (in assumption A1). (A) pMHC density of selected centrocytes, (B) Fraction of successful antigen uptake events among all FDC-B cell encounters, (C) FDC network size per B cell, (D) Fraction of Ag on FDC surface, (E) Tfh signals received by selected centrocytes, (F) Average number of divisions of recycling centrocytes, (G) Fraction of output cells among Tfh selected cells, (H) GC volume in all mechanisms. All readouts were normalized with respect to (w.r.t) the value at the peak of the GC reaction. Different colors represent the different time points with respect to GC reaction peak. The FDC network size per B cell was calculated by dividing the total number of lattice sites occupied by FDCs by the total number of GC B cells. Statistical tests were performed by Wilcoxon test. Error bars represent standard deviation of 50 simulations. Red arrows indicate a decreasing trend in readouts that differs from other mechanisms. Parameter values used in different mechanism: M1: 1 unit of Ag consumption per FDC-B cell interaction, M2: N=300, M3: FDC contraction rate = 0.166 µm per hour, M4: K ext =150, M5: K T = 600, M6: k = 0.003, M7: K K = 5. GC, Germinal center; Tfh, T follicular helper cell; Ag, Antigen; Ab, Antibody; FDC, Follicular dendritic cell. * = p < 0.05, ** = p < 0.01, *** = p < 0.001. NS, not significant.

