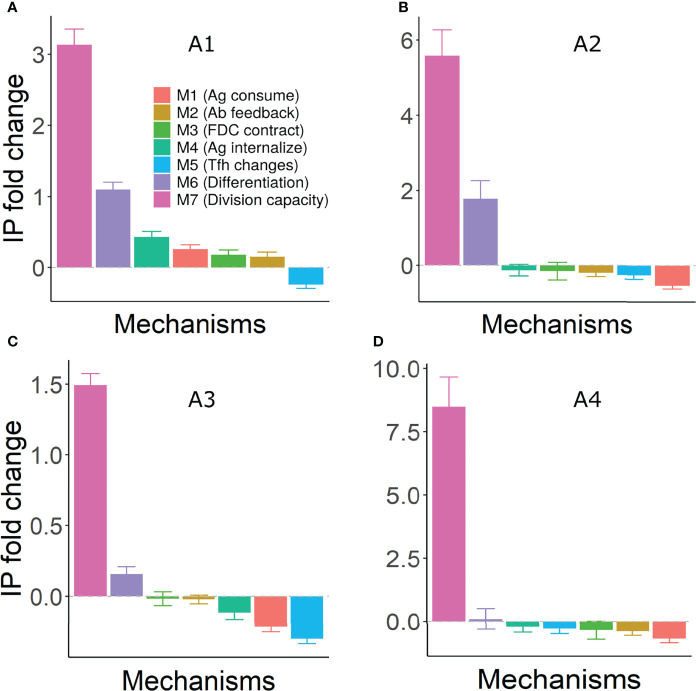
Figure 7.
Fold change in efficiency (IP) of GC reaction under different mechanisms of shutdown. Panels (A–D) represent assumptions A1-A4, respectively. IP was calculated using equation 13 at day 21 of the GC simulation and fold change was calculated with respect to the IP of the corresponding control simulation. Error bars represent standard deviation of 50 simulations. Positive and negative values represent an increase and decrease, respectively, compared to the control simulation. Parameter values used in different mechanism: M1: 1 unit of Ag consumption per FDC-B cell interaction, M2: N=300, M3: FDC contraction rate = 0.166 µm per hour, M4: K ext =150, 200, 80 and 250 in assumptions A1-A4, M5: K T = 600, M6: k = 0.003, M7: K K = 5. GC, Germinal center; Tfh, T follicular helper cell; Ag, Antigen; Ab, Antibody; FDC, Follicular dendritic cell; IP, Immune Power.

