Table 2.
Key points pertaining to insole-based systems used for fall risk assessment and fall detection.
| Reference | Sensor system and focus of work | Sensor type(s) and number | Sensor placement | Population | Parameters investigated | Data acquisition and analysis information | Other characteristics |
|---|---|---|---|---|---|---|---|
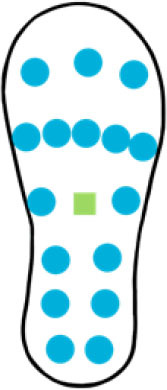
| Kraus et al. (67) | • Insole-based • Physical frailty prediction |
Pressure sensors and 6-axis IMU |
|
• Orthogeriatric patients • n = 57 • 93% women • Mean age: 77 years (SD = 6) |
• Number of steps • Stride length • Gait speed • Acceleration over gait cycle • Gait cycle time • Cadence • COP variability • Double support time |
• Physical frailty classified using: – SPPB (Short Physical Performance battery) – kNN (k-Nearest Neighbor) – RF (Random Forest) |
• Moticon Science3 insole used |
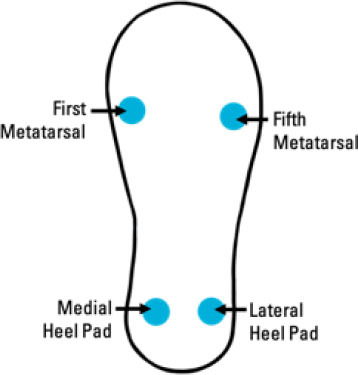
| Ayena et al. (63) | • Insole-based with UWB (Ultra-wideband) Radar • Fall risk assessment |
Piezoresistive pressure sensors (FSRs) + 3D Accelerometer + Radar system 5 sensors: • 4 FSRs (2 at hindfoot (medial heel and lateral heel), 1 at first metatarsal, and 1 at fifth metatarsal) • 1 3D Accelerometer (outside of sole) |
|
• One healthy young adult participant | • Instrumented insole provides: – Acceleration-related information – Other gait information (Temporal features) – Cadence – Stride time – Stride length – Stride speed • Radar UWB provides information regarding: – Position-based activities (Spatial features) – Stride length – Stride speed |
• Risk of Falling Score informed by stride data • Fall risk based on analyzed variability • Fall detection (based on static and dynamic acceleration) • Kalman Filter for Gait Velocity estimation • Algorithm to segment TUG (Timed Up and Go) radar signal: used for stride length, stride time, cadence, stride speed |
• FSR diameter: 13 mm • High resolution acceleration measurement: 13-bit and up to ± 16 g • Radar range: 10 m • Radar accuracy: ±10 cm • Low-power radar system |
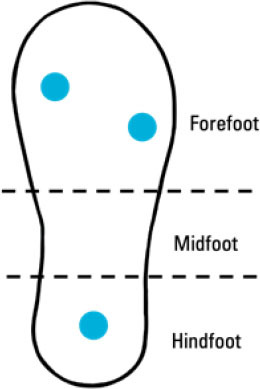
| Bucinskas et al. (64) | • Insole-based • Fall Risk Assessment |
3 piezoelectric pressure sensors • Pressure sensors developed by researchers using PVC, Velostat and aluminum foil |
|
• One participant (three trials) | • Pressure distribution • Duration of stance phases for both feet • Variation of stepping abruptness • Stepping unevenness parameters • Stepping rhythm • Size of step • Gait phase timing |
• Analysis of sensor signals in time domain • Correlation-regression analysis for absolute measurement error • Single amplitude values extracted from raw data for load distributions |
• Wireless (2.4 GHz WiFi) • Battery-powered 1,300 mAh lithium polymer battery • Activities investigated: “Turnaround,” “Scrolling,” “Upstairs,” “Downstairs,” “Upstairs one by one,” “Walk with left straight leg” |
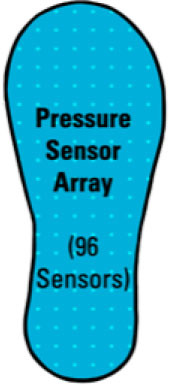
| Chen et al. (65) | • Insole-based • Fall Hazard Identification |
Pressure sensor array layer (96 pressure sensors) |
|
• Healthy individuals • n = 10 |
• Ground reaction force differences • Swing phase acceleration magnitude signal threshold crossing points • Pitch angle at initial foot contact • Pitch angle during midstance • Double support % |
• Five features used to train SVM model for fall hazard identification and safe floor activities • One-feature accuracy: 39.54% • Five-feature accuracy: 95.78% |
• Device for fall hazard identification • Activities investigated: Walking, Running, Stair ascent, Stair descent |
| Ji et al. (66) | • Insole-based • Fall Detection |
4 FSR pressure sensors (2 at forefoot, 1 at midfoot, 1 at hindfoot) |
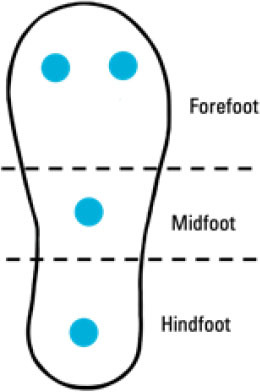
|
– | • Plantar pressure • Plantar pressure variation • Walking state |
– | • Bluetooth data transmission |
| Antwi-Afari et al. (60) | • Insole-based • Fall Risk Assessment |
• 13 Capacitive Pressure sensors: 2 at Toes; 3 at Metatarsal Head; 4 at Arch; 4 at Heel • 1 3D Acceleration sensor at middle of Arch |
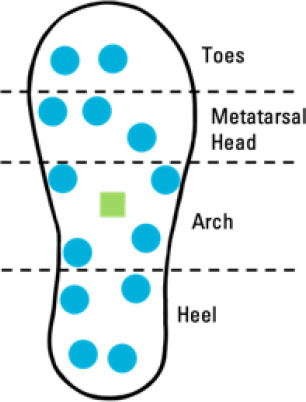
|
• Construction workers • n = 10 • Mean age: 26.50 (SD = 3.35) years |
Biomechanical gait stability parameters: • Mean pressure • Peak pressure • Pressure-time integral • Anterior/Posterior center of pressure • Medial/Lateral center of pressure (Investigated through simulation of loss-of-balance events and normal gait) |
• 50 Hz pressure sampling rate • Equations used for biomechanical gait stability parameters: • Mean Pressure = • Peak Pressure = Maximum (Pi, …, PN) • Pressure-Time Integral = • Anterior/Posterior Center of Pressure = • Medial/Lateral Center of Pressure = N = number of pressure sensors i = pressure sensor value (ith sensor) Xi and Yi = pressure sensor value coordinates |
• Wireless Data Transmission • Insole thickness: 2.5 mm • 16 MB flash memory integrated in sole • Pressure range: 0 to 40 N/cm2 • Simulated loss-of-balance events = Slip, Trip, Unexpected step-down, Twisted ankle |
| Cates et al. (61) | • Insole-based • Fall Classification |
• 4 Pressure sensors (FSRs): 2 at forefoot and 2 at hindfoot • 1 IMU Sensor at midfoot |
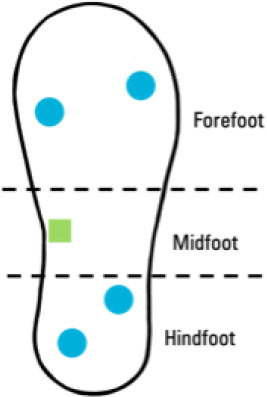
|
• Healthy males • n = 20 • Age: 28 ± 5 years |
Low-acceleration Activities of Daily Life (ADL): • Standing • Lying • Sitting • Walking • Running High-acceleration ADLs: • Stair ascent • Stair descent • Jump falls |
• Threshold and machine learning methods • Signal of sum vector magnitude filtered using 1st order low-pass butterworth filter (1Hz cut-off) • Support vector machine (SVM) fall detection algorithm • 45 features used for fall classification model • Feature selection using genetic algorithm process • 18 features associated with highest performance of fall detection |
• Device for fall classification • 20 Hz sampling rate |
| Hu et al. (62) | • Insole-based • COP Trajectory |
12 FSRs (at toes, metatarsophalangeal joints, foot arch, heel) |
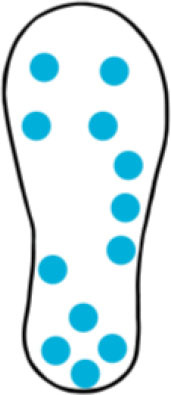
|
• n = 20 • Younger participants: – n = 10 – Age: 22.6 ± 1.5 years • Older participants: – n = 10 • Age: 65.7 ± 3.4 years |
Center of Pressure (COP) Trajectories (indicative of postural control) • Anterior-posterior direction trajectory • Medial-lateral direction trajectory |
Non-linear model used to estimate COP more accurately than typical weighted models | • 50 Hz sampling frequency • FSR diameter: 12.7 mm • Bluetooth data transmission |
| di Rosa et al. (59) | • Insole-based • Fall Risk Score |
Pressure sensors + 6D Accelerometer and Gyroscope (Sensors embedded in two layers: Pressure array layer on upper pressure-sensing layer; Other components (including inertial sensors) in second/matrix layer) |
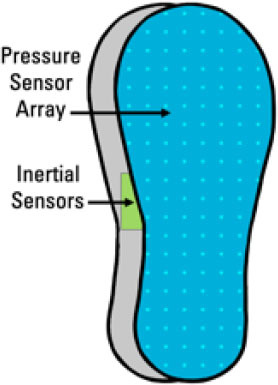
|
• Older adults (over 65 years) • n = 29 • Diverse sample used (sex, health status, mobility, etc.) |
• Double support right (fall risk index weighting: 52%) • Single support left (weighting: 31%) • Mediolateral average acceleration amplitude (weighting: 12%) • Heel strike force slope left (weighting: 5%) |
• Cluster analysis – Selected indicators: – POMA (Performance Oriented Mobility Assessment Tool) – DGI (Dynamic Gait index) – TUG (Timed Up and Go test) |
• Short range communication (Bluetooth) to mobile device • Long range communication from mobile device to computer • Worn during daily activities for 2 weeks • Comprehensive daily activity monitoring not possible (device designed for steady-state gait parameters only) |
| Das and Kumar (58) | • Insole-based • Postural Stability and Gait Parameters |
7 Piezoresistive pressure sensors • Hallux • Metatarsal 1 • Metatarsal 2 • Metatarsal 4 • Metatarsal 5 • Medial Heel • Lateral Heel |
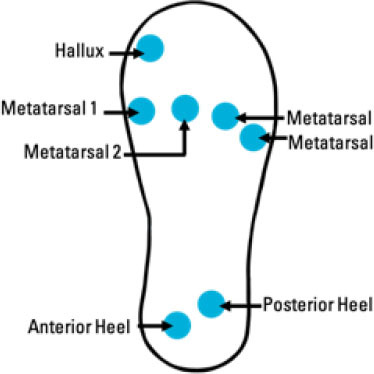
|
• Healthy males • n = 3 • Age range: 22–28 years |
Postural stability and spatiotemporal gait parameters: • Plantar Pressure • Force variation during standing and from accidental falls • Gait cycle duration • Stance duration • Swing phase time • Single support |
Data filtered using 3rd order Butterworth low-pass filter (cut-ff frequency = 50 Hz) | • Parameters calculated using Heel strike, Heel off, Toe off, Toe strike, Timer • Timer is triggered upon detection of specific gait events • Force range: 0–100 N • Accuracy: ± 2 N |
| Lincoln and Bamberg (57) | • Insole-based system + camera-based system • Slip Detection |
• 6 pressure sensors (FSRs): 4 at forefoot and 2 at heel • 1 3-axis accelerometer (not in sole) |
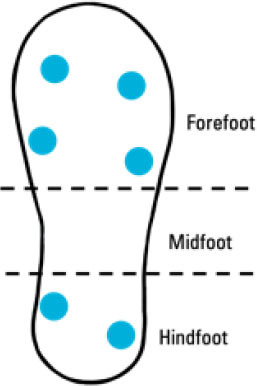
|
• n = 2 • 1 male (age = 23 years) • 1 female (age = 35 years) |
Plantar force during slip gait • Normal force • Lateral shear force • Progressional shear force • Body weight acceleration during slip gait |
Pressure and acceleration data filtered through low-pass butterworth filter (cut-off frequency = 60 Hz) | • Real-time slip detection • Slips following heel strike were investigated without falls recorded • 114 Hz sampling rate • 90% accuracy |
