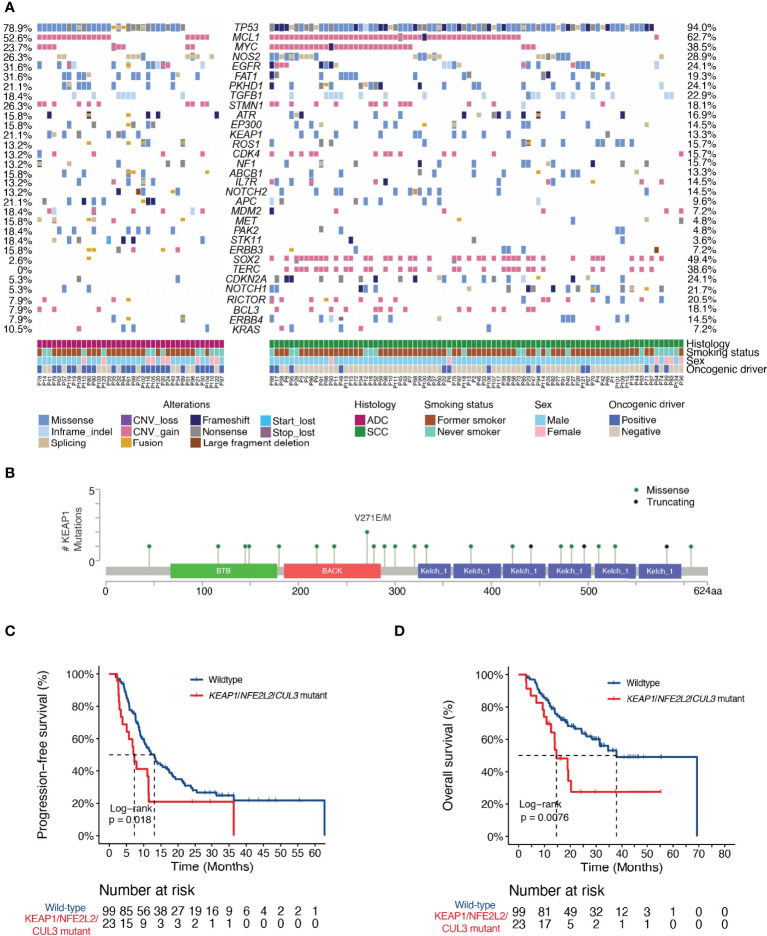
Figure 1.
Landscape of genetic variations and the associations of dCRT survival outcomes with the KEAP1-NRF2 pathway. (A) The distribution of various genetic variations in each patient was shown. Clinical characteristics of each patient were shown at the bottom. ADC, adenocarcinoma; SCC, squamous cell carcinoma. (B) Lollipop plot showing the distribution of KEAP1 mutations in the study cohort. (C, D) Kaplan-Meier estimates of (C) PFS and (D) OS in the full analysis set comparing patients with and without KEAP1-NRF2 pathway gene mutations. HR denotes hazard ratio; CI denotes confidence interval. Tick marks indicate censored data.

