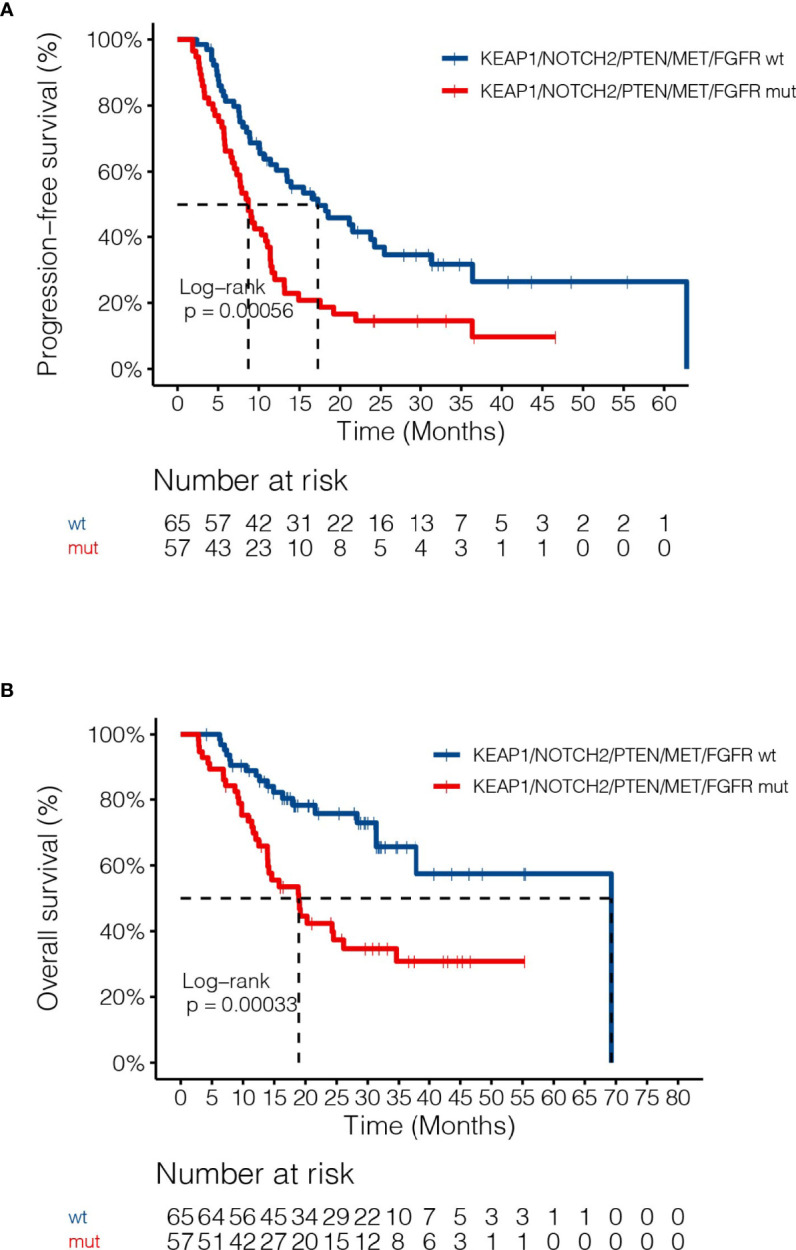
Figure 5.

Associations of dCRT survival outcomes with the mutant subgroup. (A, B) Kaplan-Meier estimates of (A) PFS and (B) OS in the full analysis set comparing patients harboring any of the MET, NOTCH2 and PTEN loss of function, as well as FGFR and KEAP1-NRF2 pathway gene alterations and those without.
