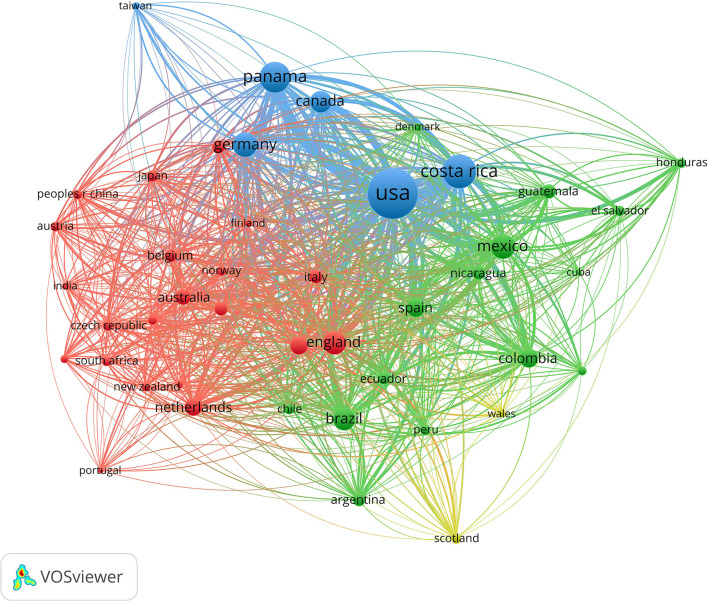
Figure 2.
Network visualization map of international research collaboration among top active countries in biodiversity research in Central America. A threshold of at least 30 co-authored publications was applied. The size of the node and connecting line is proportional to the influence of the node in the network (number of publications and collaborations). Color indicates the relatedness of each cluster (by VOSviewer 1.6.18).

