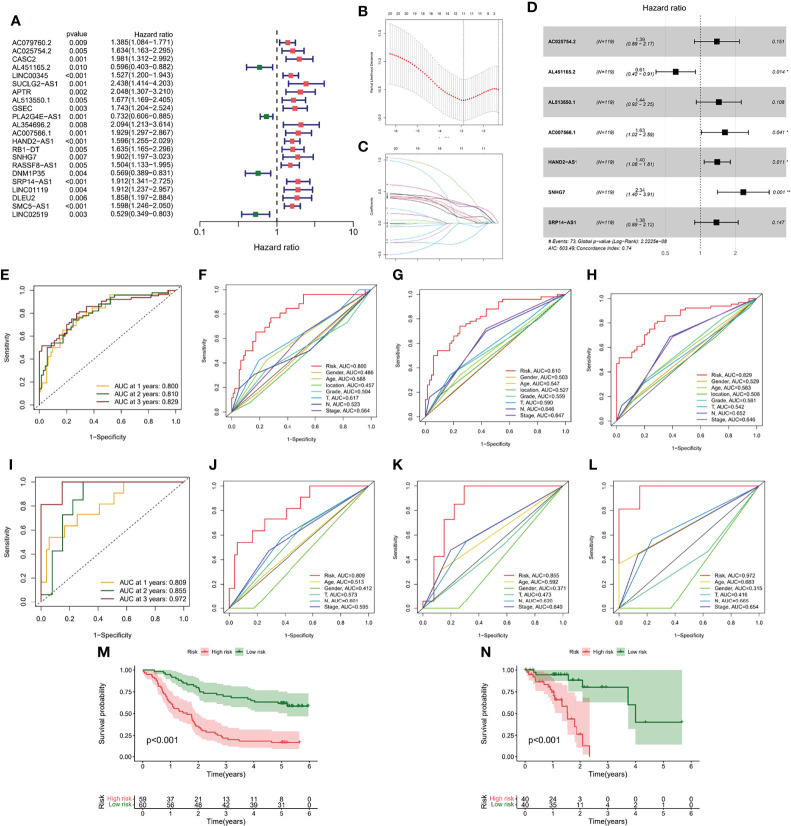
Figure 6.
Generation and verification of the m7G-LPS. (A) Univariate Cox regression analysis for 22 lncRNAs. (B) Cross-validation for tuning the coefficient selection in the LASSO regression. (C) LASSO regression of the 22 OS-associated lncRNA. (D) Multivariate Cox regression analysis for 7 lncRNAs. ROC curves and their AUC value represented 1-, 2-, and 3-year predictions in the GEO cohort (E) and TCGA cohort (I). The 1-year (F), 2-year (G) and 3-year (H) ROC analysis revealed the AUCs of m7G-related lncRNA risk score and other clinical characteristics in the GEO cohort. The 1-year (J), 2-year (K) and 3-year (L) ROC analysis revealed the AUCs of m7G-related lncRNA risk score and other clinical characteristics in the TCGA cohort. Kaplan-Meier curve of overall survival of the GEO (M) and TCGA cohorts (N).

