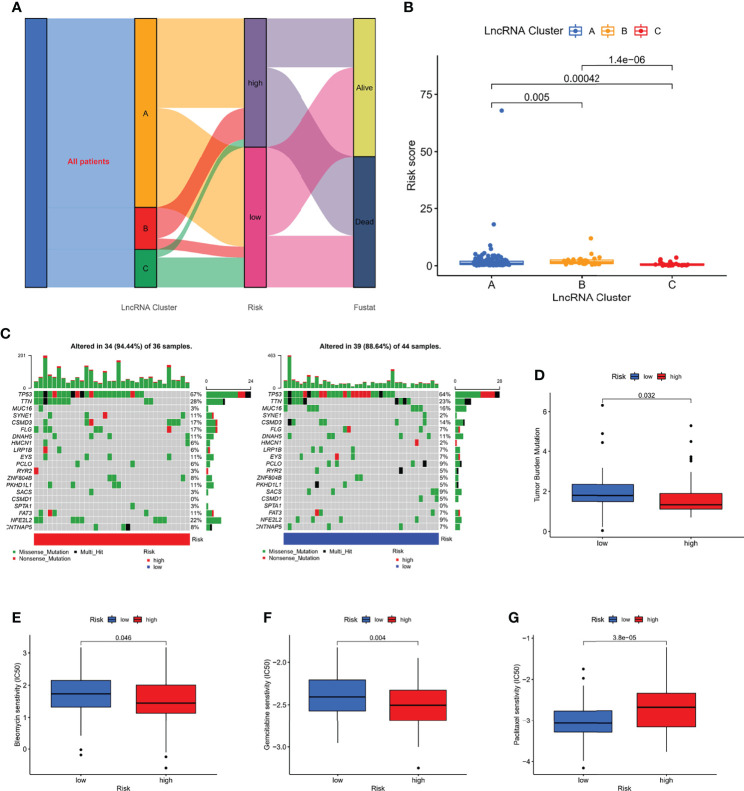
Figure 8.
Correlation of risk score with molecular clusters, gene mutations, and chemotherapy sensitivity. (A) The sankey diagram of the relationship among the clusters, risk score and survival state. (B) Risk score levels of A/B/C clusters. (C, D) The waterfall plot of somatic mutation features in different risk subgroups. (E–G) The boxplot of Sensitivity of bleomycin, gemcitabine, paclitaxel in patients with high-risk subgroup and low-risk subgroup.

