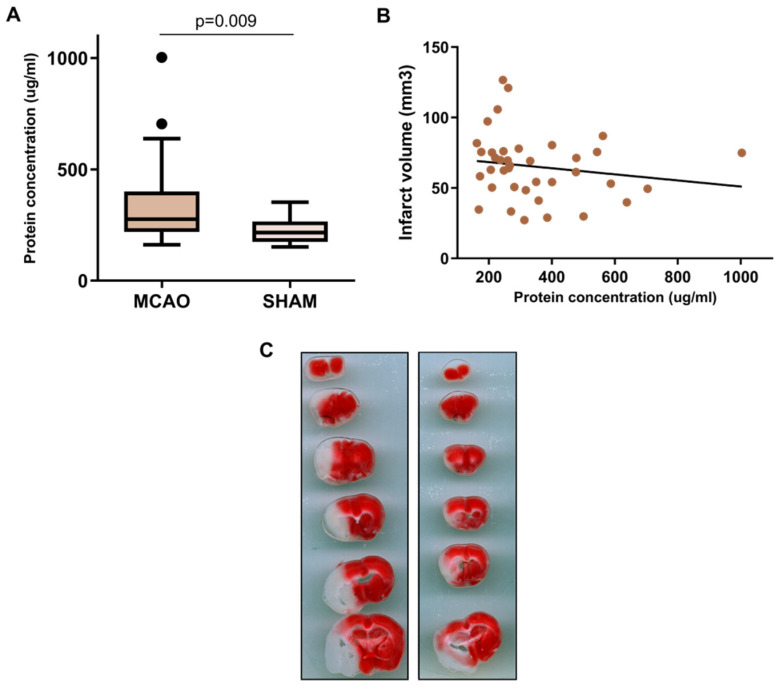
Figure 1.
Evaluation of the protein concentration in BALF. (A) Boxplot comparing the BALF protein concentration between ischemic and sham mice (N = 53) (B) Scatter plot representing the BALF protein concentration (X axis) and the infarct volume (Y axis) of the ischemic animals (N = 42). (C) Two representative images of cerebral ischemia measured by TTC staining. The boxplot in (A) shows increased protein concentration in MCAO animals compared to sham, while the scatterplot in B showed the lack of correlation between infarct volume and protein concentration. MCAO: middle cerebral artery occlusion.

