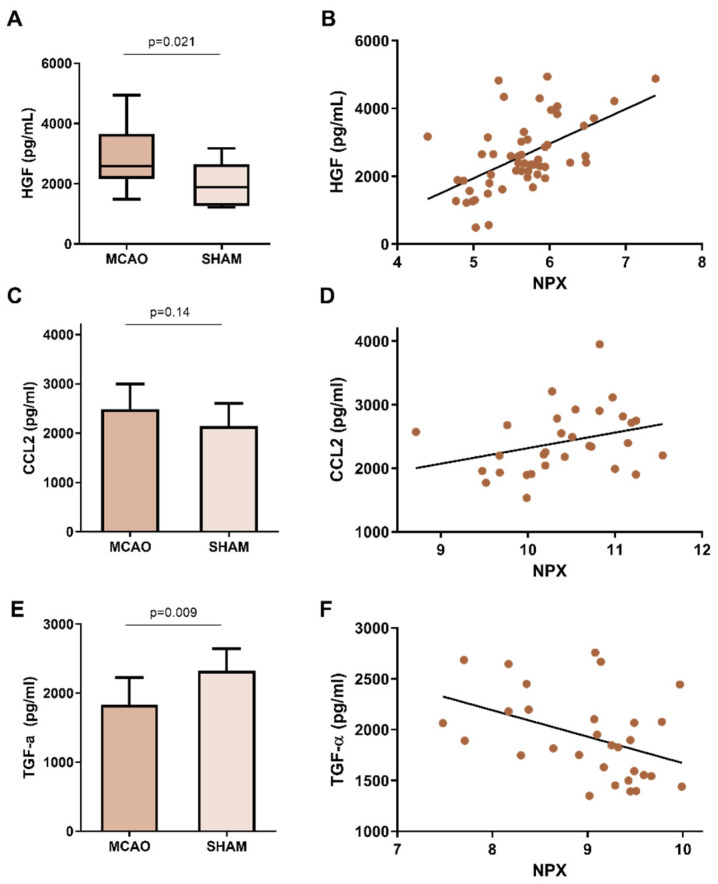
Figure 3.
HGF, CCL2 and TGF-α measurements by ELISA. (A) Boxplot comparing HGF levels in BALF of MCAO vs. sham mice (N = 49) (B) Dotplot representing HGF measurement by Olink® panel (X-axis) and measurement by ELISA (Y axis) (N = 53). (C) Boxplot comparing CCL2 levels in lung of MCAO vs. sham mice (N = 30) (D) Dot plot representing CCL2 measurement by Olink® panel (X axis) and ELISA measurement (Y axis) (N = 30). (E) Boxplot comparing TGF-α levels in lung of MCAO vs. sham mice (N = 30) (F) Dot plot representing TGF-α measurement by the Olink® panel (X axis) and ELISA measurement (Y axis) (N = 30). The boxplots showed increased HGF, a trend towards increased CCL2 and decreased TGF-a values in MCAO vs. sham animals, while the scatterplots showed positive correlations for HGF and CCL2 and a negative correlation for TGF-a. HGF: Hepatocyte Growth Factor, CCL2: C-C Motif Chemokine Ligand 2, TGF-α: Transforming Growth Factor α, ELISA: Enzyme-Linked ImmunoSorbent Assay, BALF: bronchoalveolar lavage fluid, NPX: normalized protein expression, MCAO: middle cerebral artery occlusion.

