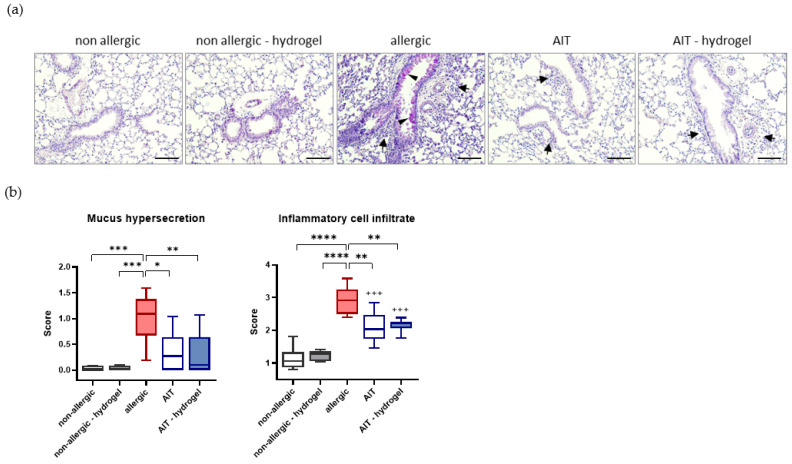
Figure 4.
Effects of AIT delivered in hydrogel compared to standard AIT treatment on mucus hypersecretion and infiltration of inflammatory cells in lung tissue. (a) Representative lung histology (PAS staining) of non-allergic, non-allergic–hydrogel, allergic, AIT, and AIT–hydrogel groups. Arrows, inflammatory infiltrate; arrowheads, mucus hypersecretion; scale bar: 100 μm. (b) Histological scoring of inflammatory cell infiltration and mucus hypersecretion (n = 6); boxplots indicate minimum, 25th percentile, median, 75th percentile, and maximum. Results were analyzed by one-way ANOVA with Tukey’s test. p-values of ≤0.05, ≤0.01, ≤0.001, and ≤0.0001 are shown as *, **, ***, and ****, respectively. p-values of AIT groups compared to the respective non-allergic groups are shown as +++.

