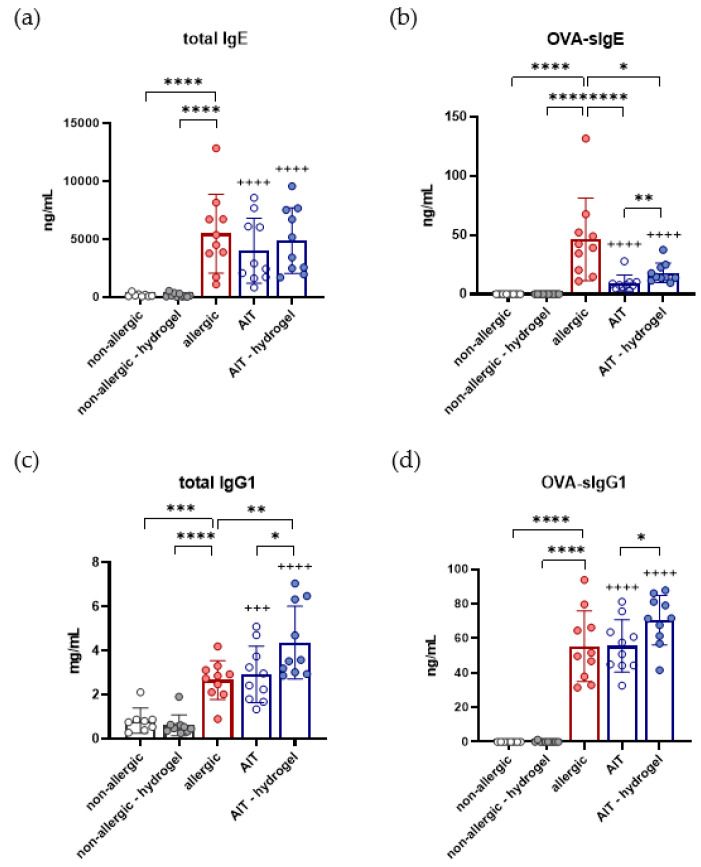
Figure 6.
Effects of both AIT treatment strategies on the humoral immune response in a murine model of allergic asthma. Measurement of total IgE (a), OVA-sIgE (b), total IgG1 (c), and OVA-sIgG1 (d) in serum samples at the endpoint of the experiment (n = 10). Gaussian and non-Gaussian distributed results were analyzed by unpaired t-test or Mann–Whitney test, respectively. p-values of ≤0.05, ≤0.01, ≤0.001, and ≤0.0001 are shown as *, **, ***, and ****, respectively. p-values of AIT groups compared to the respective non-allergic groups are shown as +++ and ++++, respectively.

